KEY TAKEAWAYS
The annualized growth in India’s industrial production accelerated sharply to a record high level of 134.4% in Apr-21 from 24.1% YoY (revised up from 22.4%) in Mar-21. The superlative print in Apr-21 was backed by an exceptionally strong statistical base since April 2020 in comparison had taken the full blow of the stringent nationwide lockdown.
We had highlighted the possibility of such a base driven rally in IIP in our previous month’s report. The starkness in growth performance is prominent in the use-based classification, wherein, the lowest growth was recorded for Primary Goods at 37.1% YoY (which per se is a series high) while the highest growth was seen in case of Consumer Durables at 1943.6% YoY. Such massive divergence in sectoral growth performance will weaken the inferences drawn from this month’s IIP growth data. Hence, we focus on the sequential changes to get a better grip of the underlying activity dynamics.
On sequential basis, we note that 24 out of 25 sub industries within IIP registered a contraction in Apr-21 over Mar-21, depicting a broad-based decline in industrial production activity. On seasonally adjusted sequential basis, the headline IIP de-grew by 1.5% MoM in Apr-21, marking its first contraction in 5-months. This captures the impact of sharp resurgence in the second wave of Covid infections that resulted in many states announcing or tightening lockdowns from the middle of Apr-21.
Outlook
While the seasonally adjusted sequential industrial production declined in April 2021, its magnitude appears to be moderate compared to some of the other high frequency indicators. The difference in the lockdowns in April 2020 (stringent and across the nation) and April 2021 (with graded stringency across states) with respect to implementation and coverage explains why the decline in sequential momentum in IIP is relatively moderate in the current phase. However, the seasonally adjusted sequential momentum is likely to decline further in May 2021 coinciding with the peak of the healthcare crisis. While this would pull down the year-on-year growth figures for the IIP in May-June 2021 from its current exorbitant levels, the push from favorable statistical base would continue to ensure that it remains elevated. Hence, one needs to look through the annualized Q1 FY22 data and focus on the underlying sequential momentum.
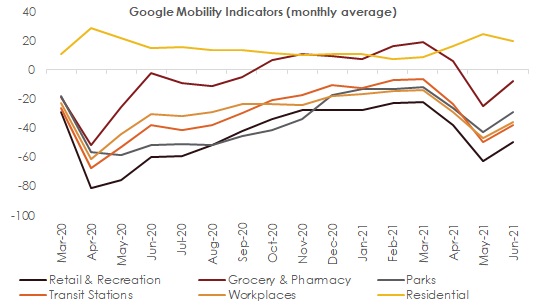
This is where things have started to turn around after a dismal phase in Apr-May 2021. Peaking of the second wave of COVID by the second half of May 2021 is gradually resulting in tapering of lockdown restrictions by states. This has started to favourably impact high frequency mobility indicators, which are now recovering, led by mobility on account of Grocery and Pharmacy.
The other silver linings in the form of strong support from global economic growth, likelihood of a normal monsoon outturn, and continued support from an accommodative policy backdrop should further aid sequential recovery in industrial activity. Having said so, we also believe that the pace of vaccination would play a key role in reducing the severity of the threat from any future wave of Covid while boosting economic confidence. As of 11th June, India had covered 14.3% of its population with one dose of vaccine. While the coverage appears to be slow in comparison to some of the developed countries (US, Eurozone, UK, etc.), expectation of enhancement of domestic vaccine manufacturing capacity along with imports of other vaccines would help to speed up the process within the next 2-months.
We continue to monitor these developments closely while sticking to our FY22 GDP growth forecast of 10.0% with some downside risk.
Annexure-1|
Weight in IIP |
Apr-20 |
Apr-21 |
Apr-20 |
Apr-21 |
|||
|
(%) |
(% YoY) |
(% YoY) |
(% YoY, 12m avg) |
(% YoY, 12m avg) |
|||
|
IIP |
100.0 |
-57.3 |
134.4 |
-5.7 |
0.9 |
||
| Sectoral Classification | |||||||
|
Mining |
14.4 |
-26.9 |
37.1 |
-1.1 |
-3.5 |
||
|
Manufacturing |
77.6 |
-66.6 |
197.1 |
-6.9 |
1.2 |
||
|
Electricity |
8.0 |
-22.9 |
38.5 |
-1.5 |
4.1 |
||
| Use-Based Classification | |||||||
|
Primary Goods |
34.0 |
-26.6 |
37.1 |
-1.9 |
-2.6 |
||
|
Intermediate Goods |
17.2 |
-63.9 |
209.2 |
3.6 |
1.1 |
||
|
Capital Goods |
8.2 |
-92.7 |
1077.1 |
-20.7 |
-4.4 |
||
|
Infrastructure/Construction Goods |
12.3 |
-85.0 |
564.0 |
-10.3 |
5.6 |
||
|
Consumer Durables |
12.8 |
-95.7 |
1943.6 |
-16.7 |
0.9 |
||
|
Consumer Non-Durables |
15.3 |
-48.1 |
95.7 |
-4.4 |
6.0 |
||
Chart 1: Sequential decline in industrial activity was broad based in Apr-21
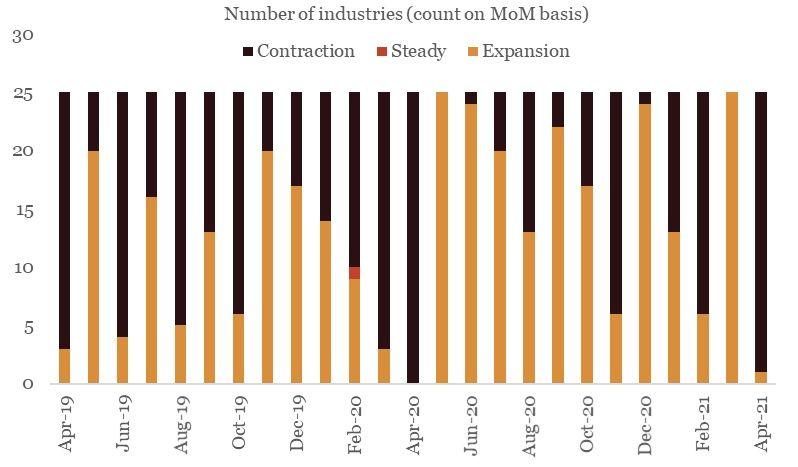
Chart 2: High frequency mobility indicators have turned around after bottoming out in May-21
 +91 99698 98000
 info@acuite.in
 Follow us
 +91 22 49294000
 DOWNLOAD