KEY TAKEAWAYS
India’s IIP growth rose a tad in Aug-21 to 11.9%YoY from 11.5% in Jul-21, largely in line with market expectations. The expansion was largely the outcome of a favorable base, as sequentially the index contracted by 0.2%MoM after posting strong expansion over Jun-Jul-21.
Key Takeaways
Comparison with Aug-19
Outlook
In our opinion, the annualized IIP growth here on, is likely to drift lower into single digits as the favorable statistical base fades. Additionally, a potential power shortage triggered by the recent energy crisis amidst lower coal supplies can have a near term impact on industrial activity. Lack of adequate coal and power availability may impact manufacturing sectors which had plans to ramp up their production amidst recovery in domestic and export demand. While the impact of the global semiconductor chip shortage is already being felt by the domestic automotive sector, other industries such as consumer durables and electronics are also likely to face production constraints ahead of the festive season amidst chip shortage.
While we expect low sequential growth in IIP over the next few months given the raw material shortages and higher commodity prices in certain sectors, we maintain our FY22 annual GDP forecast at 10.0% led by:
Progress on vaccination: At present, India has inoculated almost 50% of its population with single dose and fully vaccinated around 20%. As coverage nears three fourth of the population by year-end, it should provide a strong boost to consumer sentiment and demand recovery.
Annexure-1
Chart 1: Breadth of manufacturing recovery deteriorates in Aug-21
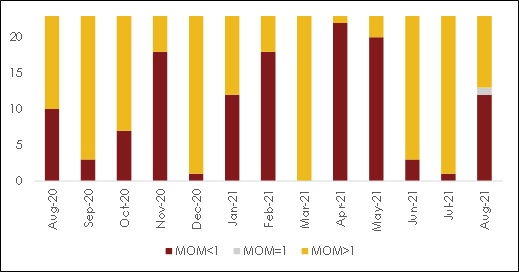
Table 1: Anatomy of IIP growth
|
Weight |
Aug-20 |
Aug-21 |
Apr-Aug |
Apr-Aug |
|||
|
IIP |
100 |
-7.1 |
11.9 |
-25.0 |
28.6 |
||
| Sectoral Classification | |||||||
|
Mining |
14.4 |
-8.7 |
23.6 |
-18.0 |
25.1 |
||
|
Manufacturing |
77.6 |
-7.6 |
9.7 |
-27.9 |
31.2 |
||
|
Electricity |
8 |
-1.8 |
16.0 |
-10.4 |
15.4 |
||
| Use-Based Classification | |||||||
|
Primary Goods |
34.1 |
-4.8 |
-0.9 |
-16.4 |
18.2 |
||
|
Capital Goods |
8.2 |
7.1 |
-1.6 |
-47.6 |
60.1 |
||
|
Intermediate Goods |
17.2 |
3.2 |
-0.6 |
-27.2 |
39.9 |
||
|
Infrastructure/Construction Goods |
12.3 |
1.6 |
1.1 |
-30.2 |
44.9 |
||
|
Consumer Durables |
12.8 |
10.2 |
-0.3 |
-47.5 |
54.0 |
||
|
Consumer Non-Durables |
15.3 |
-6.2 |
0.8 |
-10.3 |
10.2 |
||
 +91 99698 98000
 info@acuite.in
 Follow us
 +91 22 49294000
 DOWNLOAD