FY21 has proved to be a good year for the Indian cement sector. While the disruption caused by the Covid pandemic led to operational and demand challenges in the first half of FY21, the recovery in the second half drove a strong improvement in sector profitability for the whole year. An analysis undertaken by Acuité Ratings for the 10 major listed cement companies highlights that the net profits surged by 29.6% on an average although aggregate revenues grew modestly by 3.8%. Cost rationalisation and low cost inventory played a key role in the expansion of EBITDA margins, which went up 349 basis points to 24.3% in FY21. Price hikes undertaken by cement players in the later part of the fiscal, further supported the profitability improvement.
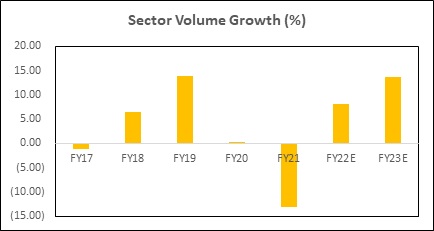
While domestic cement consumption declined by 8.0%YoY in H1FY21 due to Covid related disruption, the sector witnessed a significant recovery in H2FY21 amid a step up in infrastructure and construction activities in the country. Our study shows that the volume growth of the top ten cement players stood at 2.6% in FY21, which is divergent from an overall 13.1% volume decline in the sector. In our opinion, this clearly highlights the ongoing consolidation and the strengthening market position of the larger companies.
Although the cement sector saw severe headwinds in demand in the early half of last year, it did benefit from the lower prices of key operating costs i.e. petroleum coke and diesel. These inputs represent power, fuel and freight costs, which account for 25%-30% of the total operating costs of the sector. The cost structure, however, was challenged in H2FY21, when prices of petroleum coke rose by 29% and diesel prices by 15% over H1FY21. Nevertheless, availability of low-cost inventory and change in fuel mix enabled cement players to report stronger EBITDA margin.
Better operating efficiencies have also played a key role in supporting the improving operating margins in FY21. Several players lowered the consumption of petroleum coke by increasing the use of imported coal; while coal prices also increased, it has been available at a relatively cheaper rate. The increasing use of waste heat recovery systems has also started to contribute to better efficiencies. The power & fuel and freight cost of the major cement players, on an aggregate basis, declined by 18.0% and 10.6%, respectively, in FY21 over FY20.
Apart from variable cost management, cement companies also managed to lower some of their fixed cost component like employee cost and interest expenses. Despite the revenue growth albeit modest in the top ten listed cement companies, their aggregate interest expenses dropped significantly by 22.4%YoY in FY21, reflecting the impact of both better working capital management as well as slightly lower interest rates.
The EBITDA per ton of cement for the top cement companies has sharply increased by 50.54% over the period FY19-FY21. We believe that cost efficiencies, better economies of scale of the larger players along with lower raw material prices have been instrumental in such improvement. With continued fuel inflation, the pace of growth in operating profitability (EBITDA per ton) is however, likely to moderate in FY22. Yet, higher realisation supported by price hikes and product mix may continue to support the higher profitability.
Notwithstanding the pandemic scenario, the sector saw 20 million tons of cement capacity coming on stream in FY21. While uncertainty over Covid-led disruptions had led to some players delaying or postponing their capital expenditure plan, the subsequent recovery and rising cement consumption in H2FY21 supported the capacity addition in the later part of the fiscal. Understandably, H1FY21 hardly saw any capacity addition and almost entire capacity addition took place in H2FY21. In FY21, eastern region witnessed highest capacity addition of 11 million tons with players like Shree Cement Ltd., ACC Ltd., Ramco Cements Ltd., and Dalmia Bharat Ltd, among others, augmenting their cement capacity.
Cement capacity is expected to grow at a CAGR of 5% during FY22 to FY23 and in the current year 28 million tons of cement capacity is projected to come on stream. Larger players would continue to drive capacity addition, resulting in further consolidation in the sector. Players like UltraTech Cement, Shree Cement, Birla Corporation, Ramco Cements and India Cements have already announced plans to expand capacities further over the medium term. There would also be increased capital expenditure for installation of waste heat recovery systems and upgradation of clinker units that will further drive operating efficiencies. Given the strong cash accruals of these larger cement companies, however no significant intake of debt or increase in leverage is likely over the medium term.
The second wave of Covid expectedly, has disrupted the cement volume growth in Q1FY22. The railway freight traffic for cement was down 20-23%MoM in April and May. Cement demand is nevertheless, expected to see good recovery post monsoon led by the government’s thrust on infrastructure activities and housing construction. Acuité estimates pan India cement volumes to grow at a CAGR of 10-11% during FY22-FY23. The growth would also be supported by lower base of FY21.
The key driver of cement demand over the medium term is clearly, the focus on infrastructure and housing sector. Under the PMAY-G (Gramin) scheme, 39.7 lakh houses have been sanctioned in FY21 and construction of only 8.5 lakh houses have been completed. On the other hand, under PMAY-U (Urban), 112.5 lakh houses have been sanctioned, while 48.3 lakh houses have been completed. This along with fresh housing targets for FY22, implies a significant pipeline of under construction housing projects that will support cement demand.
Annexure
Chart 1: Top 10 listed Cement Companies – Revenue & Earnings
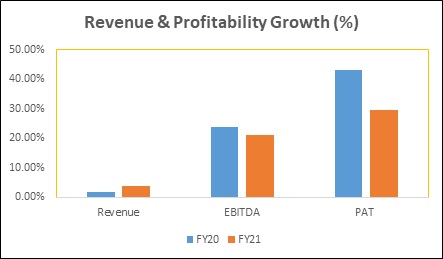
Chart 2: Top 10 listed Cement Companies – Profit Margins
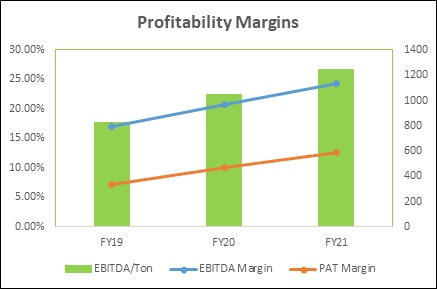
Chart 3: Top 10 listed Cement Companies – Cost Structure
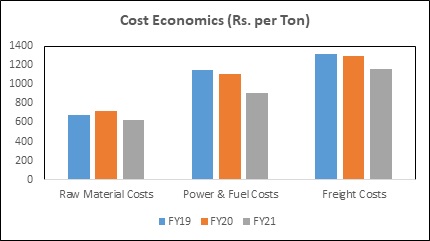
Chart 4: Capacity Addition – Industry- FY21
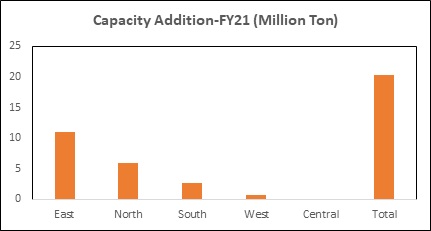
Chart 5: Sector Volume Growth, Actuals+ Projections
 +91 99698 98000
 info@acuite.in
 Follow us
 +91 22 49294000
 DOWNLOAD