Corporate India cleared the pandemic test but the emerging inflation test may be tougher
Acuité has undertaken a comprehensive analysis of the financial performance of 1370 listed non-financial companies (referred to as the group) over the two year pandemic period i.e. FY21 and FY22. The objective of the aggregated analysis has been to decipher the revenue and the profitability trajectory of the overall corporate sector since the beginning of the pandemic to the end of the third wave. We have also made an effort to understand the trend of leverage and capital expenditure in this group. Additionally, we have also undertaken a segment-wise analysis of the respective financial performance in the manufacturing, services, and the other sectors. Lastly, we have attempted to understand the dynamics of the MSME businesses in this group.
Key Messages
Part I. Overall Corporate Sector
Chart 1: Total Revenue, PBDIT and PAT for the Group over FY20-22 in Rs Lakh Cr
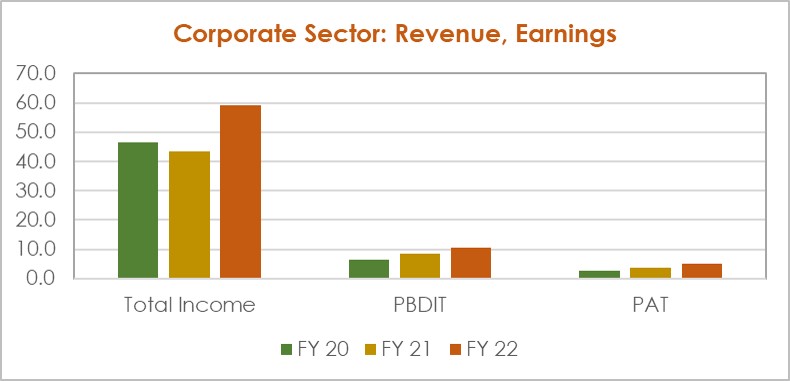
On an aggregated basis, revenues of the group slipped by only 6.4% in the first year of the pandemic (FY21) and recovered sharply by 36.0% in FY22 despite the second and third Covid wave, effectively translating into a CAGR of 12.8% revenue growth over the 2-yr period.
The distinguishing element of corporate performance during this period, however, has been on the profitability front. Both operating profit (PBDIT) and net profit (PAT) have consistently grown over the last 2 years with a CAGR of 26.6% and 34.8% respectively, clearly one of the highest growth in any two year block over the last couple of decades.
As regards operating margins and net margins, the group witnessed an uptick of over 500 bps and 250 bps respectively in FY21 vs FY20. However, such high operating margins could not be sustained in FY22 due to the firming up of commodity prices, dropping thereby by 130 bps vs FY21. Nevertheless, the net margins have continued to hold on in FY22.
Largely, the improvement in the corporate sector margins over the 2 yr pandemic period has been driven by cost efficiencies and rationalization measures which significantly offset any impact of slower revenue growth.
Chart 2: Operating and Net Margins for the Group over FY20-22
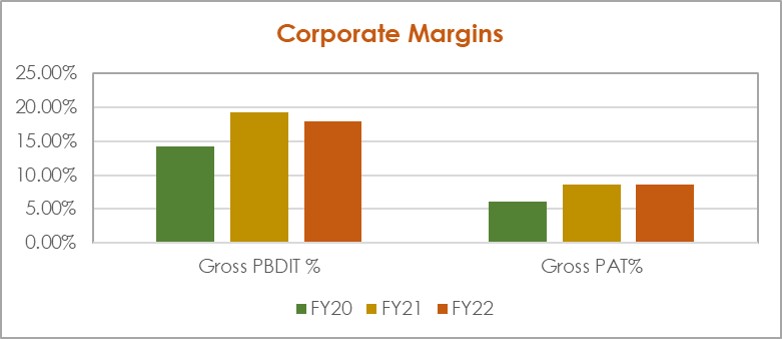
Table 1: Segmental data on revenues and profitability
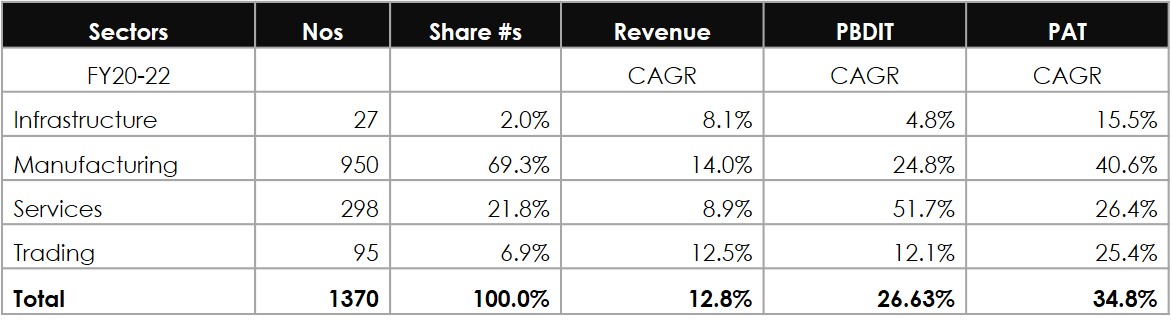
The group selected for analysis clearly has a bias for the manufacturing sector as this is the reflection of the overall listed entity portfolio. The manufacturing sector has grown its topline at a faster pace of 14.0% in FY20-22 as compared to the services sector @8.9% which can be explained by the disproportionately larger impact of the pandemic on the services businesses particularly those which are contact intensive. Clearly, manufacturing has been relatively resilient and demand has been driven also by sustained export growth over the last 2 years in certain product categories such as pharma and chemicals.
Table 2: Segmental data on corporate margins
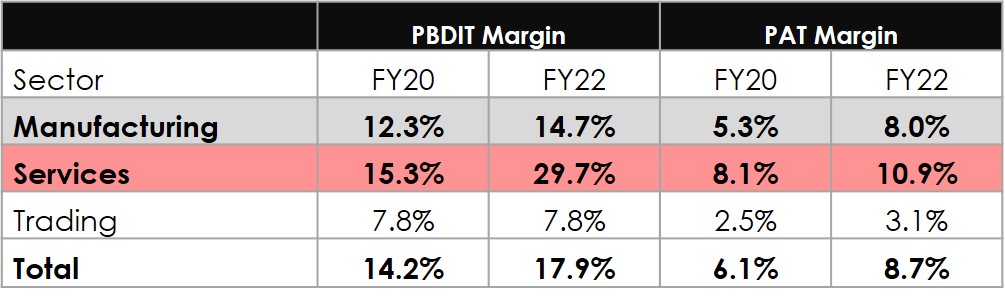
It is interesting to note the significant jump in the operating margins of the services sector despite the effect of the pandemic. The average operating margins rose sharply to 24.4% in FY21 and further to 29.7% in FY22. This is primarily driven by the significant recovery in the operating profitability of large telecom sector companies through tariff rationalization as also the improved volumes in the healthcare sector after the unlocking of the mobility restrictions.
The margin improvement in the manufacturing sector has been less sharp although in terms of absolute figures, the aggregate PBDIT in the 950 companies increased by 55.7% between FY20 and FY22. The key driver for the margin enhancement has been clearly the lower raw material and other operating costs in the larger part of the pandemic period. With the spurt in global commodity prices particularly after the geo-political crisis, such margins will clearly not be sustainable.
Chart 3: Moderate improvement in leverage
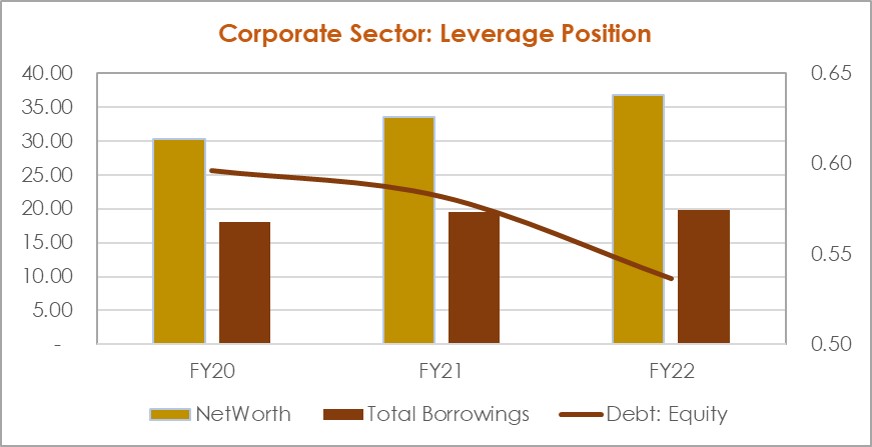
The deleveraging story in the corporate sector is borne out through the aggregated data with the overall leverage improving from 0.60 times as on Mar-20 to 0.54 times as on Mar-22. What has driven the improvement is the higher profitability and the cash accruals which have led the cumulative networth to climb up by 21.7% over the 2-yr period. While debt has increased to a moderate extent by 9.5%, a significant part is possibly due to the drawal of ECLGS loans were made available at a competitive rate.
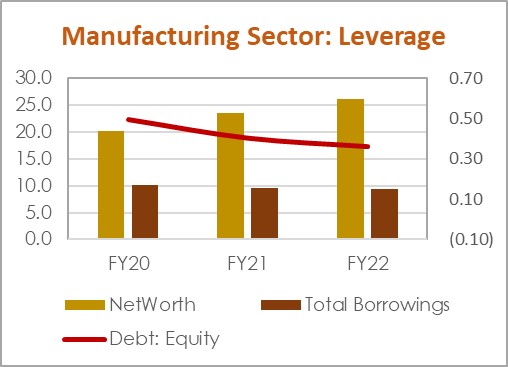
From a segmental perspective, the trajectory of leverage is however, distinctly different in the case of manufacturing and services. For manufacturing companies, the average leverage has dropped to a larger extent from 0.50 times as on Mar-20 to 0.36 times as on Mar-22. Importantly, the absolute level of debt has decreased by 6.4% over FY20-22 for the set of 950 companies in our sample, highlighting the redemption of long term debt through operating cash flows.
Chart 4: Contrasting leverage trajectory in manufacturing vs services
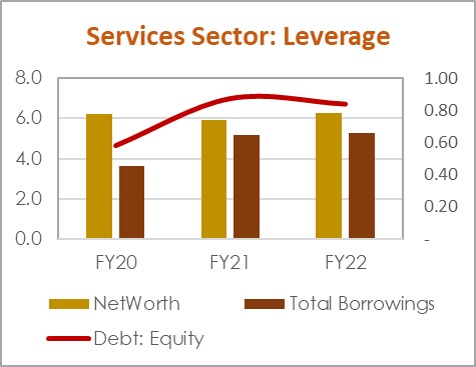
However, the scenario is different for the services businesses where the leverage has actually increased from 0.58 times as on Mar-20 to 0.84 times as on Mar-22. The gross borrowings in the services sector have actually increased by 46.0% during this period which reflects the raising of additional debt through schemes like ECLGS to fund the gap in the operating cashflows arising from the pandemic disruption. Clearly, the additional debt taken during the pandemic period will need to be repaid over the next 1-2 years and from that perspective, the revival in their respective markets will become critical. Our analysis shows that 8% of the services companies in our sample have a leverage over 1.5 times as on Mar-22 and may witness a deterioration in credit quality if their businesses don’t see an adequate revival in the near to medium term.
In our analysis, we have also attempted to capture the corporate capex trajectory during the pandemic period. We computed the capital expenditure incurred by this set of 1370 companies over the FY20-22 period and looked at it from the materiality perspective vis-à-vis the net fixed assets as on Mar-20. Using a defined criterion, we thereafter categorised the capex into small, moderate and large buckets.
Chart 5: Corporate Capex Trajectory
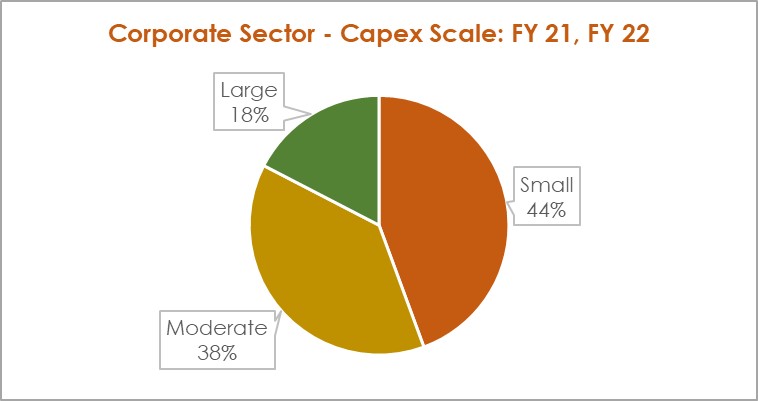
The net fixed assets of the Group has grown modestly by 4.5% over the 2-yr period which is largely in line with expectations in a pandemic disrupted and muted demand environment. But our analysis shows that 56% in the Group have incurred moderate to large capital expenditure over this period. Most of this capex, however, has been funded by internal accruals as is observed from the leverage and the debt figures.
Part II. Dynamics of the MSME Sector
The last part of our analysis is focused on the performance of the listed MSME companies during the pandemic period. We have categorised MSMEs broadly in line with their revised definition i.e. average annual revenues less than Rs 250 Cr over FY20-FY22. The total numbers of such companies stood at 518 among the group size of 1370 companies with a slightly larger proportion of services and trading companies as compared to the overall portfolio.
Table 3: Segmental data on revenues and profitability for MSME sector
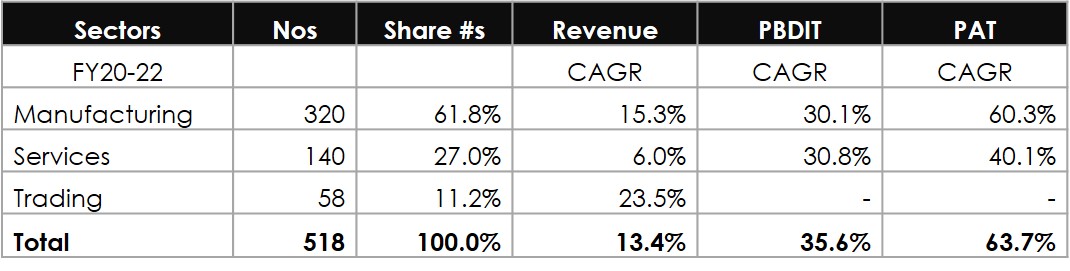
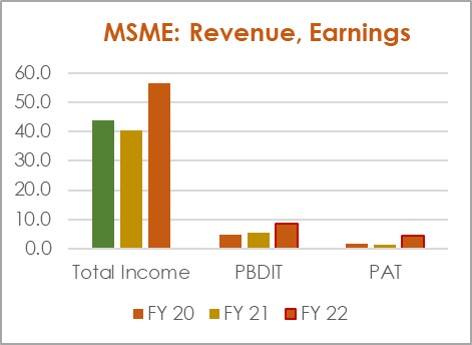
The data reveals that the recovery of the overall MSME sector has been more significant than the large corporate set with a 2-yr revenue CAGR of 13.4% and a PAT CAGR of 63.7%. Some of the trading businesses were actually incurring losses before the pandemic due to the economic slowdown and the supply bottlenecks have given them an opportunity to improve on their performance.
Chart 6: MSME Sector Performance
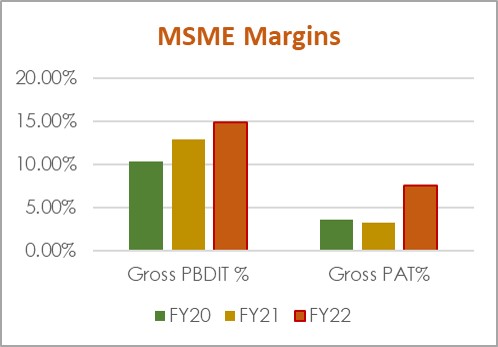
While the extent of improvement in the operating and the net margins have been slightly lower than in the large corporate sector, it is perceptible and reflects a healthy revival in the MSME sector as well.
Chart 7: MSME Leverage Trajectory
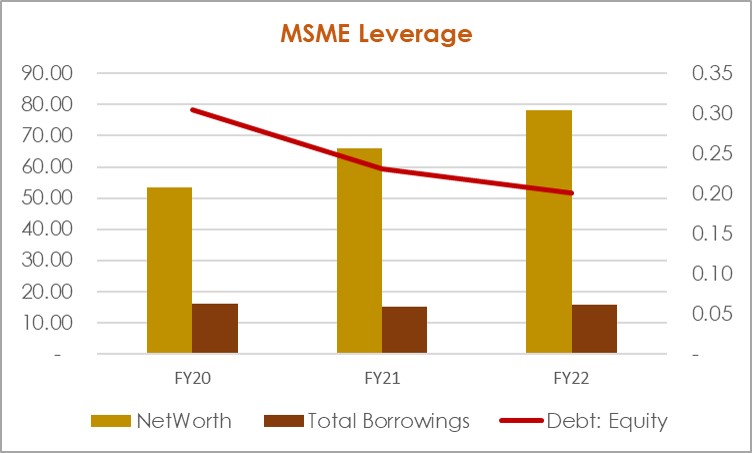
The average leverage in the MSME segment has declined to 0.20 times as on Mar-22 which is significantly lower than that in the overall corporate sector (0.54 times). The distribution of leverage reveals that only 8.3% of the MSME listed companies have a leverage of over 1.5 times which can lead to a potential stress over the medium term.
While the data in the current listed sample may not be reflective of the entire MSME ecosystem, it does highlight that the stress among the listed companies is quite limited after the recovery in FY22.
 +91 99698 98000
 info@acuite.in
 Follow us
 +91 22 49294000
 DOWNLOAD