KEY TAKEAWAYS
India’s merchandise deficit saw a sharp uptick in Dec-20 to USD 15.5 bn compared to USD 9.9 bn in Nov-20 and USD 12.5 bn a year ago.
The expansion of the trade deficit was led by a sharper rise in imports vis-a-vis exports on a sequential basis. To put this in perspective, while exports in Dec-20 rose by USD 3.6 bn, imports recorded an increase of USD 9.2 bn – the sharpest monthly increase on record.
Exports: A marginal rebound
Dec-20 exports stood at USD 27.2 bn compared to USD 23.5 bn a month ago. On an annualized basis, exports eked a small positive growth after a gap of two months, at 0.1%.
On a commodity wise basis, monthly uptick in exports was driven by 1) Engineering goods 2) Petroleum products and 3) Organic and inorganic chemicals. Together these three categories explain around 65% of the sequential rise in outbound shipments in Dec-20.
Imports: The "Mover” of the month
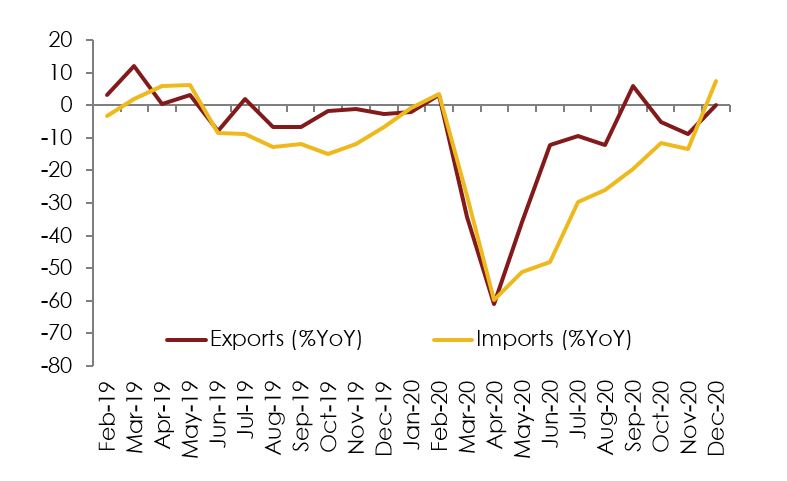
Imports in Dec-20 at USD 42.6 bn surpassed the pre-COVID peak of USD 41.1 bn as of Jan-20, and in fact stand at a 19-month high. The increase was broad based – as imports in all three sub-categories of 1) Oil 2) Gold and 3) Non-oil non-gold registered a sequential ramp up. On an annualized basis, import growth turned positive for the first time since the onset of the pandemic, at 7.6%YoY, as it surpassed the growth in exports also for the first time since Feb-20 (see chart).
Oil imports, in Dec-20 rose to the highest level seen in this fiscal year so far, at USD 9.6 bn compared to USD 6.3 bn in the previous month. The rise in oil imports reflects the cumulative impact of firming of domestic fuel demand as well as price of India crude basket to the tune of ~20% over the months of Nov-Dec-20.
Gold importsimports rose to a 19-month high of USD 4.5 bn from USD 3.0 bn a month ago. Some correction in global gold prices may have further supported domestic demand amidst the onset of the festive and wedding season.
Non-oil non-gold imports rose to a 17-month high of USD 28.5 bn from 24.1 bn in Nov-20, reflecting the recovery in domestic demand which had seen a sharp correction amidst the pandemic. Further, it is interesting to note and positive in some sense, that within Non-oil non-gold imports, recovery is widespread. Of the 28 broad categories of non-oil non-gold imports, 17 registered an improvement, while 9 categories registered a negligible change and only 2 registered a decline versus Nov-20. As such, on a commodity-wise basis, there are no clear front-runners. The top 3 – Transport equipment, Machinery and Precious stones, explain only a modest 45% of the sequential increase in imports.
Conclusion
Typically, a sharp expansion of the trade deficit is considered worrisome; However, the Dec-20 trade deficit needs to be viewed from a different lens in the Covid milieu. The widening led by higher imports should be seen as yet another sign of economy and especially demand gradually limping back towards normalcy, having been "locked” for a good part of this fiscal year. Encouragingly, the growth has been driven by a mix of both investment and consumption imports.
Looking ahead, the sustainability in both exports and imports needs to be watched. The continued rise in Covid infections in both US and Europe and accompanying containment measures, could have some ebbing impact on our export momentum in Q4 FY21. Imports, on the other hand, could remain elevated amidst rising prices of global crude and industrial metals, along with return of cyclical domestic demand. As such, higher monthly trade deficits maybe here to stay at least over Jan-Mar quarter.
Thereafter, a faster rollout of vaccine in DMs in FY22 should allow a stronger recovery in exports to gain ground, allowing the monthly trade balance to settle in a range of USD 10-13 bn, akin to the pre-pandemic levels; assuming that crude oil prices do not see a flare up and domestic demand continues to progressively recover.
Table 1: Merchandise Trade Balance
| India's trade dynamics (USD bn) | ||||
| Dec-19 | Nov-20 | Dec-20 | ||
| Exports | 27.11 | @23.5 | 27.2 | |
| Oil | 3.63 | 1.5 | 2.2 | |
| Imports | 39.59 | 33.4 | 42.6 | |
| Oil | 10.72 | 6.3 | 9.6 | |
| Gold | 2.46 | 3.0 | 4.5 | |
| Non-oil non-gold | 28.5 | 24.1 | 26.41 | |
| Trade Balance | -12.49 | -9.9 | -15.4 | |
Chart 1: Export and Import Growth- CY19-20
 +91 99698 98000
 info@acuite.in
 Follow us
 +91 22 49294000
 DOWNLOAD