KEY TAKEAWAYS
India’s industrial production decelerated to a 10-month low of 0.4% YoY in Dec-21 from 1.3% in Nov-21 (revised lower from 1.4%). The actual print for Dec-21 was softer than market expectation of 1.3-1.8% (range of median consensus from various polls).
Despite the moderation in headline IIP growth, which was accompanied by a negative surprise, signals from overall assessment appear balanced otherwise.
Key granular details and observations
Outlook
Going by the sequential recovery seen in most lead indicators in the month of Dec-21, it was expected that IIP growth too may show a modest improvement. This was also corroborated in our proprietary AMEP (Acuité Macroeconomic Performance) index, which exhibited a similar outturn, expanding by 3.0% MoM in Dec-21 from a contraction of 11.3% MoM seen in Nov-21. (The index for the month of Dec-21 stood at 114.6 from 111.2 in Nov-21). Given the drag from adverse statistical base effect, the actual annualized print turned out to be softer.
Going forward, subdued industrial activity is likely to spill over to Jan-22 on account of adverse impact from the spread of Omicron variant that prompted many states to reimpose restrictions on mobility and contact-intensive services. While industrial and export related activities saw minimal restrictions, disruption from the leptokurtic wave of Covid infection cannot be ruled out.
The policy environment also remains conducive for overall economic growth:
On the downside, continued stress on global supply chains for select commodities on account of China’s Zero Covid policy, elevated input prices amidst significant spike in commodity prices, scaling back of fiscal and monetary policy support in most economies, and likelihood of financial market volatility (amidst rising interest rates and prospects of quantitative tightening) could weigh on overall growth momentum.
Annexure-1
Chart 1: Broad based sequential expansion seen in IIP sectors in Dec-21
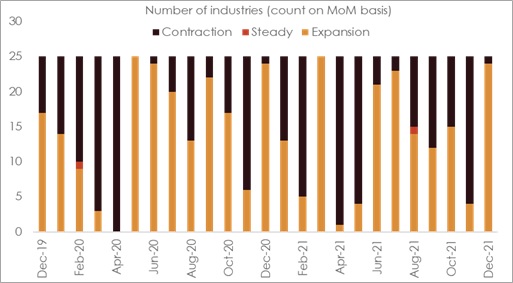
Chart 2: Despite improvement, capacity utilization remains below pre-Covid levls
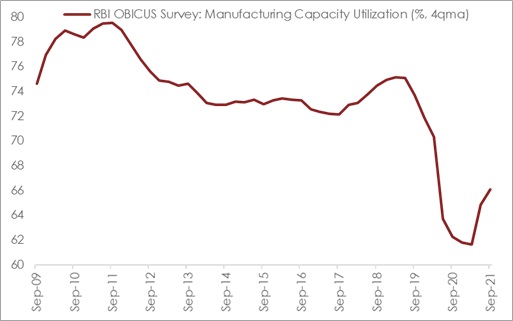
Table 1: IIP growth at a glance
| IIP Growth (%YoY): Break-up | |||||||
|
Weight |
Dec-20 |
Dec-21 |
Apr-Dec FY21 |
Apr-Dec FY22 |
|||
|
IIP Headline |
100.0 |
2.2 |
0.4 |
-13.3 |
15.2 |
||
| Sectoral Classification | |||||||
|
Mining |
14.4 |
-3.0 |
2.6 |
-11.0 |
16.0 |
||
|
Manufacturing |
77.6 |
2.7 |
-0.1 |
-14.9 |
16.0 |
||
|
Electricity |
8.0 |
5.1 |
2.8 |
-3.6 |
9.4 |
||
| Use-Based Classification | |||||||
|
Primary Goods |
34.1 |
0.4 |
2.8 |
-9.9 |
11.8 |
||
|
Capital Goods |
8.2 |
2.2 |
-4.6 |
-27.4 |
24.2 |
||
|
Intermediate Goods |
17.2 |
2.3 |
0.3 |
-14.6 |
20.6 |
||
|
Infrastructure/Construction Goods |
12.3 |
3.1 |
1.7 |
-14.8 |
23.9 |
||
|
Consumer Durables |
12.8 |
6.5 |
-2.7 |
-24.5 |
20.4 |
||
|
Consumer Non-Durables |
15.3 |
1.9 |
-0.6 |
-4.5 |
5.4 |
||
 +91 99698 98000
 info@acuite.in
 Follow us
 +91 22 49294000
 DOWNLOAD