KEY TAKEAWAYS
India’s merchandise trade deficit moderated from its record high level of USD 22.9 bn in Nov-21 to USD 21.7 bn in Dec-21. Both exports and imports expanded sequentially in Dec-21 and created new monthly record highs respectively.
For the first nine months of FY22, cumulative trade deficit stands at USD 142 bn, significantly higher than USD 126 bn seen in the corresponding pre-pandemic period of FY20.
Exports: Move from lowest to highest point in just a month
In value terms, merchandise exports scaled a new high of USD 37.8 bn in Dec-21 vis-à-vis USD 30.0 bn in Nov-21 (its lowest monthly figure in FY22 so far). This translates into a 25.9% MoM expansion, the best in last nine months.
Cumulative exports for the first nine months of FY22 stand at USD 301.4 bn, an expansion of 26.5 % compared to the corresponding pre-pandemic period of FY20.
Imports: Scale a new high
Merchandise imports touched a record high level of USD 59.5 bn in Dec-21 from USD 52.9 bn in Nov-21, translating into a 12.3% MoM expansion. At a granular level:
Cumulative imports for the first nine months of FY22 stand at USD 443.8 bn, an expansion of 21.9% compared to the corresponding pre-pandemic period of FY20.
Outlook
The near-term outlook on trade deficit continues to face uncertainty from both price as well as demand side factors.
After correcting over Nov-Dec 2021, most international commodity prices firmed up in Jan-22. In particular, price of India Crude Basket is currently trading around USD 83-84 pb levels, close to its post pandemic high compared to a low of ~USD 70 pb seen during Nov-Dec 2021. Demand for commodities continues to remain strong on account of i) sharper recovery in the goods sector vis-à-vis services, ii) continuing accommodative monetary and fiscal policies in most countries, and iii) receding threat of Omicron’s virulence.
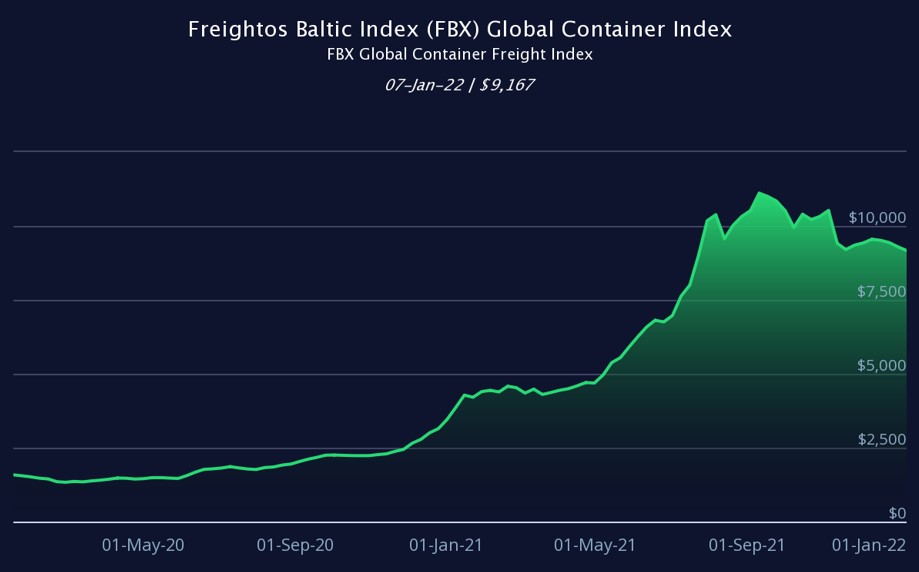
This is accompanied with a moderation in shipping costs from peak levels in Sep-Oct 2021 primarily on account of steps taken by the US to boost port efficiency and ease congestion. However, China’s strict zero Covid policy has once again started resulting in congestion at some of its ports amidst reports of spread of Omicron.
The impact of higher international commodity prices and easing of port congestion (excluding in China) would result in higher value of merchandise trade, something that has been clearly visible in recent months. Further, for an import dependent country like India, this would also imply higher pressure on trade deficit, at least over the next 6-8 months.
Nevertheless, the rapid spread of Omicron is likely to have a sharp, albeit temporary impact on merchandise trade. While past experience with respect to earlier Covid waves suggest the likelihood of a sizeable shrinage of trade deficit, the same is unlikely to play out in the current circumstance as i) the severity of lockdown restrictions are moderate in comparison, and ii) international commodity prices are elevated in contrast to the previous Covid waves.
While demand side factors could see a mild moderation, the same is likely to be temporary going by the current indications. Early trends show an early peaking of incremental infections in Mumbai (can be considered as epicenter of Omicron’s spread in India), similar to South Africa’s Gauteng. If this trend holds, then incremental cases could potentially peak within the next 2-4 weeks for the country as a whole. Once cases start to recede, pent-up demand would spring back. Ongoing vaccination (~65% and ~46% of the total population currently covered by a single and double dose respectively) with extension of coverage for 15-18 year old population besides select provision for the third booster dose, will further supplement the demand recovery.
Our recently revised FY22 current account deficit forecast of USD 46 bn from USD 38 bn has taken into account these dynamics earlier. We stick to that projection while monitoring the unfolding of Omicron at a global level, including in India.
Table 1: Highlights of merchandise trade balance
| India's merchandise trade highlights (USD bn) | ||||
| Dec-20 |
Dec-21 |
Apr-Dec FY21 |
Apr-Dec FY22 |
|
| Exports | 27.2 | 37.8 | 201.4 | 301.4 |
| Oil Exports | 2.3 | 5.9 | 17.4 | 43.9 |
| Non-oil exports | 24.9 | 31.9 | 183.8 | 257.9 |
| Imports | 42.9 | 59.5 | 262.8 | 443.8 |
| Oil imports | 9.6 | 19.2 | 53.8 | 118.3 |
| Gold Imports | 4.5 | 4.7 | 16.8 | 38.0 |
| NONG imports | 28.8 | 35.5 | 189.7 | 284.7 |
| Trade Balance | -15.7 | -21.7 | -61.4 | -142.4 |
Chart 1: Global shipping rates, though still elevated, have started to cool down
 +91 99698 98000
 info@acuite.in
 Follow us
 +91 22 49294000
 DOWNLOAD