KEY TAKEAWAYS
India’s industrial production contracted for second month in a row with Feb-21print of -3.6% YoY, weaker compared to Jan-21 growth print of -0.9% YoY (revised up from -1.6% earlier). To be sure, market expectations were geared towards a negative print (-3.0% as per consensus) on the back of weak core sector data and other subdued high frequency indicators – however, the magnitude of contraction turned out to be higher – for second month in a row.
On sequential basis, the IIP contracted by 5.0% MoM in Feb-21 against an average (seen in the current data series with 2011-12 as base) contraction of 3.7% seen in the month of Feb as against Jan. While lesser number of working days in Feb-21 in comparison to Feb-20 can partly explain the weakness, the magnitude of decline certainly points towards a loss in overall momentum.
The Internals: Dismal on all counts
Outlook
With two consecutive months of contraction in industrial activity, the optimism surrounding a strong V-shaped recovery is somewhat getting tempered, especially if one juxtaposes the recent developments with the re-imposition of lockdown measures in select states suffering from a strong second wave of COVID infection. This could weigh on industrial activity in the coming months, although we believe the impact would be lower compared to the earlier phase lockdown in Mar-May 2020.
Nevertheless, there is a silver lining because of which the expectation of a V-shaped recovery (supported by a strong statistical base effect) remains intact:
Having said so, we would closely monitor the evolution of lockdown in select states and its impact on near term economic activity to gauge the extent of downside risk (if any) to our FY22 GDP growth expectation of 11.0%.
Annexure-1
Table 1: Break down of IIP growth
|
Weight in IIP |
Feb-20 |
Feb-21 |
Apr-Feb FY20 |
Apr-Feb FY21 |
|||
|
(%) |
(% YoY) |
(% YoY) |
(% YoY) |
(% YoY) |
|||
|
IIP |
100.0 |
5.2 |
-3.6 |
1.0 |
-11.3 |
||
| Sectoral Classification | |||||||
|
Mining |
14.4 |
9.6 |
-5.5 |
1.9 |
-9.6 |
||
|
Manufacturing |
77.6 |
3.8 |
-3.7 |
0.7 |
-12.6 |
||
|
Electricity |
8.0 |
11.5 |
0.1 |
1.8 |
-2.4 |
||
| Use-Based Classification | |||||||
|
Primary Goods |
34.0 |
8.2 |
-5.1 |
1.2 |
-8.5 |
||
|
Intermediate Goods |
17.2 |
23.0 |
-5.6 |
12.2 |
-12.2 |
||
|
Capital Goods |
8.2 |
-9.6 |
-4.2 |
-11.4 |
-23.5 |
||
|
Infrastructure/Construction Goods |
12.3 |
2.8 |
-4.7 |
-1.5 |
-12.2 |
||
|
Consumer Durables |
12.8 |
-6.2 |
6.3 |
-6.2 |
-19.6 |
||
|
Consumer Non-Durables |
15.3 |
-0.3 |
-3.8 |
2.0 |
-4.6 |
||
Chart 1: After showing recovery vis-s-vis pre COVID levels in Q3 FY21, IIP sub industries have seen a contraction in output thereafter
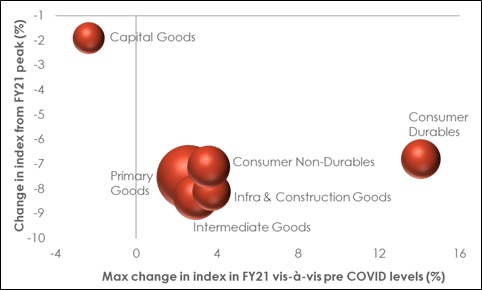
Note: Size of the bubble denotes the respective weight in IIP
 +91 99698 98000
 info@acuite.in
 Follow us
 +91 22 49294000
 DOWNLOAD