KEY TAKEAWAYS
- India’s merchandise trade deficit eased to USD 12.6 bn in Feb-21 from USD 14.5 bn in Jan-21 but printed higher vis-à-vis USD 10.2 bn seen in Feb-20.
- In line with seasonality, the sequential decline in merchandise trade deficit in Feb-21 was accompanied by a marginal increase in exports along with a marginal decline in imports.
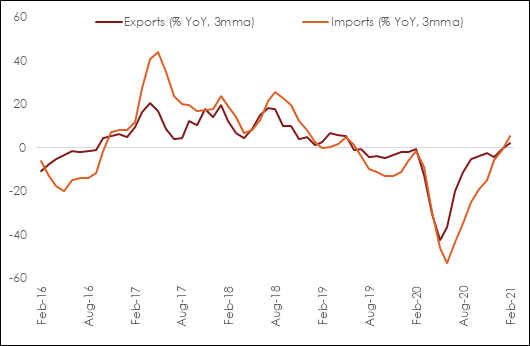
- Positive annualized growth in exports and imports for three straight months has taken the headline deficit figures to pre COVID levels.
- While the second wave of COVID infections could cause some disruption in the near term, the impact on trade would be limited with rapid progress in vaccination and continued support from accommodative monetary and fiscal policies.
- Although the sharp run up in global commodity prices in last 4-5 months explains bulk of the trade deficit normalization for India, it could get reinforced further on the anticipated V-shaped recovery.
India’s merchandise deficit eased to USD 12.6 bn in Feb-21 from USD 14.5 bn in Jan-21 but printed higher vis-à-vis USD 10.2 bn seen in Feb-20, the month prior to the global spread of COVID.
The sequential moderation in merchandise trade deficit in Feb-21 was accompanied by a marginal increase in exports along with a marginal decline in imports vis-à-vis the previous month. This appears to be in line with the usual seasonal trend (in 17 out of the last 20-years, the merchandise trade deficit has eased in Feb vis-à-vis Jan).
Exports: Healthy trajectory
Exports in Feb-21 came at USD 27.9 bn (+0.7% YoY) vis-à-vis USD 27.4 bn in Jan-21. This happens to be a 21-month high print on outbound shipments. At a granular level:
- Bulk of the sequential increase came from Petroleum exports that has started to revive and rose to USD 2.7 bn in Feb-21 from USD 2.2 bn in Jan-21. This was followed by exports of Agriculture and Allied products (led by rice) that rose to USD 2.6 bn in Feb-21 from USD 2.3 bn in Jan-21.
- Some modest retracement was observed in case of Machinery exports (USD 7.1 bn in Feb-21 vs. USD 7.4 bn in Jan-21) and Gems and Jewellery exports (USD 2.7 bn in Feb-21 vs. USD 2.8 bn in Jan-21).
- Compared to pre COVID levels in Feb-20, the following have registered an increase in value terms:
- Agriculture and Allied Products
- Ores and Minerals
- Chemicals and Products
- Plastic and Rubber
- Stone, Plaster, Cement, etc.
- Handicrafts
Imports: Seasonal moderation
Imports in Feb-21 stood at USD 40.5 bn (+7.0% YoY) vis-à-vis USD 42.0 bn in Jan-21.
- Bulk of the sequential moderation was led by Ores and Minerals (USD 1.7 bn in Feb-21 vs. USD 2.3 bn in Jan-21), Agriculture and Allied Products (USD 1.2 bn in Feb-21 vs. USD 1.6 bn in Jan-21), Electronics Items (USD 4.8 bn in Feb-21 vs. USD 5.3 bn in Jan-21), and Petroleum Products (USD 9.0 bn in Feb-21 vs. USD 9.4 bn in Jan-21).
- Among heavy weights, it is noteworthy that oil imports have been moderating sequentially for the last two months despite significant buildup in prices (average price of India Crude Basket rose from USD 50 pb in Dec-20 to USD 61 pb in Feb-21). This reflects the impact of degrowth in volume of oil consumption (between Feb-21 and Dec-20, volume of petroleum consumption fell by 7.6%).
- Meanwhile, Gems and Jewellery stood out as the only category that saw a sequential increase in imports to USD 7.7 bn in Feb-21 from USD 6.2 bn in Jan-21. This happens to be a 45-month high print driven by elevated price of precious metals (last 3-month average annualized change in gold and silver prices stand at 19.5% and 47.4% respectively) and the pent-up demand in this category on account of disruptions from COVID earlier in the year.
- Compared to pre COVID levels in Feb-20, the following have registered an increase in value terms which reflect a broad based albeit gradual pickup in both industrial and consumer demand:
- Gems and Jewellery
- Chemicals and Products
- Plastic and Rubber
- Paper and Products
- Base Metals
- Optical, Medical and Surgical Instruments
- Textiles
- Electronics Items
Conclusion
Notwithstanding the month-on-month volatility, we note that both exports and imports have been on the recovery path with annualized growth in positive territory in the last 3-months. This reflects the manufacturing led V-shaped recovery in the global economy that is also imparting an upside to global commodity prices. The relatively higher growth in imports in the last 3-months (5.5% YoY vs. 2.3% YoY for exports) also signals that incrementally India’s domestic demand is on the path of recovery, with support from favorable statistical base effect and accommodative monetary and fiscal policies.
In the near term, there could be some minor disruption to external trade on account of the fresh wave in COVID infections, globally as well as in India. However, the impact is likely to be limited as the same could get offset with ongoing rapid progress in vaccination in several countries – in just about 3-months, nearly 2.8% of the world population has received at least one dose of COVID vaccine.
India’s trade deficit appears to have normalized vis-à-vis pre COVID levels. However, bulk of that normalization is likely to have been driven by the sharp increase in global commodity prices, esp. in the last 4-5 months. Going forward, as activity levels pickup further, the widening of India’s trade deficit would get reinforced.
Table 1: Merchandise Trade Balance
| India's merchandise trade highlights (USD bn) |
|
Feb-20 |
Jan-21 |
Feb-21 |
| Exports |
27.7 |
27.4 |
27.9 |
| Petroleum Exports |
3.4 |
2.2 |
2.7 |
| Gems & Jewellery Exports |
3.0 |
2.8 |
2.7 |
| Core Exports |
21.3 |
22.4 |
22.5 |
| Imports |
37.9 |
42.0 |
40.05 |
| Petroleum Imports |
10.8 |
9.4 |
9.0 |
| Gems & Jewellery Imports |
4.9 |
6.2 |
7.7 |
| Core Imports |
22.2 |
26.3 |
23.8 |
| Trade Balance |
-10.2 |
-14.5 |
-12.6 |
| Petroleum Balance |
-7.3 |
-7.2 |
-6.3 |
| Gems & Jewellery Balance |
-1.9 |
-3.4 |
-5.0 |
| Core Balance |
-0.9 |
-3.9 |
-1.3 |
Chart 1: Exports and imports trending up
 +91 99698 98000
 info@acuite.in
 Follow us
 +91 22 49294000
 DOWNLOAD