KEY TAKEAWAYS
India’s IIP growth rose marginally in Jan-22 to 1.3%YoY vs. an upwardly revised 0.7% (prior 0.4%) in Dec-21. This was largely in line with the median market consensus of 1.5%. In addition, on a positive note, sequentially the index remained unchanged vs. Dec-21 despite the month capturing nearly the full impact of the Omicron wave. This validates our view of Covid related restrictions being less severe on industry and export-oriented sectors amidst the third wave.
Outlook
IIP growth at the start of 2022 has displayed resilience to the Omicron impact, with no sequential setback to output and annualised growth seeing a marginal improvement. This is somewhat in contrast to other high frequency indicators, which had seen a non-trivial albeit short-lived setback in momentum in Jan-22. The sharp ascent and decline in Omicron cases in a span of a month (beginning late Dec-21 up to Jan-22 end), saw in tandem swift imposition and thereafter withdrawal of restrictions on economic activity. This time however, the restrictions were biased towards contact intensive services, with industrial and export sectors remaining largely outside the ambit.
Omicron concerns have given way to geopolitical worries since late Feb-22. The invasion of Ukraine by Russia, has sent commodity prices soaring (CRB index is up by 16% since end Jan-22) including crude oil prices. The actual impact on macros and in particular growth will remain dependent on longevity and severity of tensions, via impact on the following:
Higher
input costs
Input
cost pressures have remained elevated over the past one year, with WPI
inflation averaging at over 12.5%YoY over Apr-Jan FY22. The run-up in the
commodity prices since Jan-22 and sharply in some like crude oil since the
start of the Russia-Ukraine conflict, runs the risk of re-acceleration in
producer prices which will exert pressure on profit margins and value add.
Trade channel disruption
While Russia and Ukraine both are small trade partners for India, the ongoing conflict can adversely impact some sectors disproportionately such as Project goods, Paper and Printing, Vegetable oils, Defence Equipment, Chemicals etc., along with the possibility of extending ongoing supply disruptions for longer. Further, downside in global growth may adversely impact domestic exports in FY23.
Investment cycle
The recovery in private investment cycle anticipated in H2 FY23 could turn tentative, owing to the potential uncertainty in domestic demand amidst lurking inflationary pressures from fuel price revisions. IIP granular data does already highlight a broader slowdown in rural demand.
Further, downside risks to growth have emerged from possible financial market volatility, as key global central banks normalize monetary policies at a faster pace amidst geopolitics fanning inflation pressures further.
Owing to these factors, we see downside risk to our FY22 and FY23 GDP growth forecast of 9.2% and 7.5%, both respectively.Our base case growth forecast for FY23, rests on infrastructure spending as highlighted in the Union Budget FY23, healthy progress on vaccination along with broadly accommodative monetary and fiscal policies. The geopolitical scenarios and its impact will remain on close watch.
Annexure-1
Table 1: Drivers of contraction in capital and
consumer goods growth
| Top 10 laggards over Oct-21 to Jan-22 (4MMA) | |||
| Capital Goods | Weight in IIP | Consumer Durables | Weight in IIP |
| Harvesters and threshers | 0.21 | Air Coolers | 0.04 |
| Other agricultural machinery | 0.03 | Electric heaters | 0.25 |
| Rice milling machines | 0.03 | Shaving razors/ razor blades | 0.03 |
| Tractor tyres | 0.08 | Incandescent Lamps | 0.00 |
| UPS in Solid State Drives | 0.05 | Blankets | 0.01 |
| Dumpers and Loaders | 0.12 | Bicycles - all types | 0.09 |
| Agricultural Tractors | 0.40 | Electric filament type lamps | 0.02 |
| Solar power system | 0.02 | Mattresses made of foam/coir | 0.05 |
| Mining machinery | 0.02 | Carpets & other floor textiles | 0.06 |
| Water purification apparatus | 0.10 | Two-wheelers | 1.36 |
Chart 1: Breadth of manufacturing recovery deteriorates in Jan-22
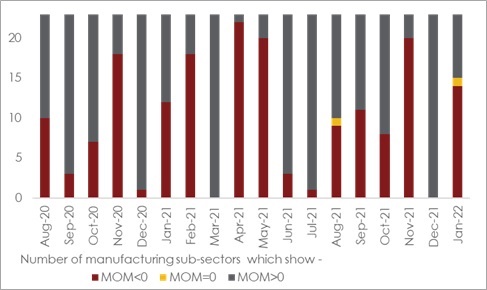
Table 1: IIP growth at a glance
| IIP Growth (%YoY): Break-up | |||||||
|
Weight |
Jan-21 |
Jan-22 |
Apr-Jan FY21 |
Apr-Jan FY22 |
|||
|
IIP Headline |
100.0 |
-0.6 |
1.3 |
-12.0 |
13.7 |
||
| Sectoral Classification | |||||||
|
Mining |
14.4 |
-2.4 |
2.8 |
-9.9 |
14.2 |
||
|
Manufacturing |
77.6 |
-0.9 |
1.1 |
-13.4 |
14.3 |
||
|
Electricity |
8.0 |
5.5 |
0.9 |
-2.7 |
8.5 |
||
| Use-Based Classification | |||||||
|
Primary Goods |
34.1 |
0.7 |
1.6 |
-8.8 |
10.6 |
||
|
Capital Goods |
8.2 |
-9.0 |
-1.4 |
-25.5 |
20.8 |
||
|
Intermediate Goods |
17.2 |
2.0 |
0.9 |
-12.8 |
18.3 |
||
|
Infrastructure/Construction Goods |
12.3 |
2.3 |
5.4 |
-13.0 |
21.6 |
||
|
Consumer Durables |
12.8 |
-0.1 |
-3.3 |
-22.0 |
17.5 |
||
|
Consumer Non-Durables |
15.3 |
-5.4 |
2.1 |
-4.6 |
5.1 |
||
 +91 99698 98000
 info@acuite.in
 Follow us
 +91 22 49294000
 DOWNLOAD