KEY TAKEAWAYS
Amidst continued waning of the favorable base, IIP growth moderated further in Jul-21 to 11.5% YoY compared to 13.6% in Jun-21. The print however came in a tad above market consensus expectations which was pegged at 10.2%.
Looking beyond the headline, sequential momentum remained strong for the second consecutive month, with the index jumping by 7.2%MoM over and above the 5.7% gain recorded in Jun-21. The continued unwinding of lockdown restrictions at the state-level, improvement in personal mobility amidst infection caseload remaining fairly ranged helped quicken the pace of recovery in industrial activity in Jul-21.
Outlook
Looking beyond Jul-21, sequential recovery in industrial activity is expected to continue aided by the onset of the festive season, even as headline annualized growth begins to moderate from current levels. On a FYTD basis, IIP has clocked a growth of 34.1% compared to a contraction of 29.3% over the same period last year.
Support to incremental recovery is likely to come from:
The other silver lining in the form of strong support from global economic growth to domestic exports and an accommodative policy backdrop (both monetary and fiscal) should further aid sequential recovery in industrial activity. Having said so, subsequent IIP readings could show some degree of volatility in Q2 FY22, before stabilizing in H2 FY22. We continue to track these developments along with the continuing high level of infections in select states that highlight the potential risks of another wave. We continue to stick to our FY22 GDP growth forecast of 10.0% albeit with some downside risk.
As such, we continue to retain our FY22 growth forecast at 10.0% with downside risks.
Possible risks to growth do remain from the possibility of a third wave of infections, though the loss of economic momentum is expected to be lower in comparison to the second wave. Recent shortfall in availability of semiconductor chips constraining auto production also remains a developing story on watch.
Annexure-1
Chart 1: Unevenness in recovery seen at granular level, compared to 2019
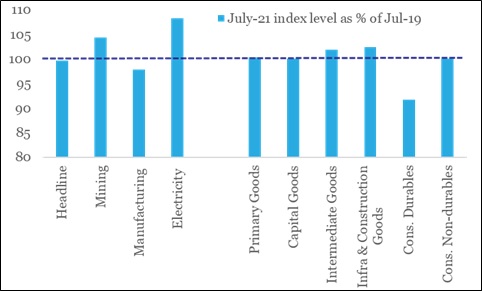
Chart 2: Manufacturing sector is still tracking lower compared to its pre-Covid period
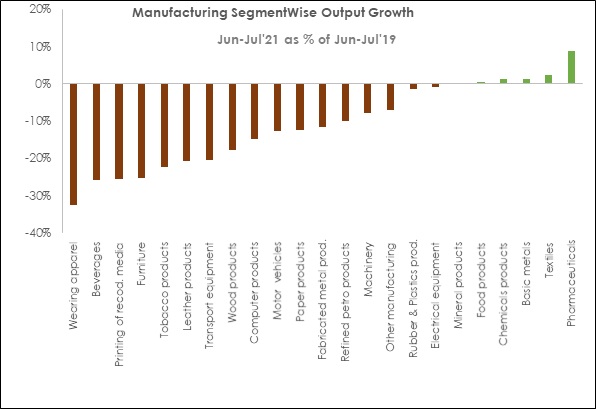
Table 1: Anatomy of IIP growth
|
Weight in IIP |
Jul-20 |
Jul-21 |
Apr-Jul |
Apr-Jul |
|||
|
IIP |
100.0 |
-10.5 |
11.5 |
-29.3 |
34.1 |
||
| Sectoral Classification | |||||||
|
Mining |
14.4 |
-12.7 |
19.5 |
-20.1 |
25.3 |
||
|
Manufacturing |
77.6 |
-11.4 |
10.5 |
-32.9 |
39 |
||
|
Electricity |
8 |
-2.5 |
11.1 |
-12.5 |
15.2 |
||
| Use-Based Classification | |||||||
|
Primary Goods |
34.1 |
-10.8 |
12.4 |
-17.8 |
18.5 |
||
|
Capital Goods |
8.2 |
-22.8 |
29.5 |
-55.0 |
77.7 |
||
|
Intermediate Goods |
17.2 |
-10.7 |
14.1 |
-32.9 |
50.5 |
||
|
Infrastructure/Construction Goods |
12.3 |
-8.2 |
11.6 |
-37.2 |
57.2 |
||
|
Consumer Durables |
12.8 |
-23.7 |
20.2 |
-56.4 |
79.2 |
||
|
Consumer Non-Durables |
15.3 |
1.8 |
-1.8 |
-12.1 |
12.0 |
||
 +91 99698 98000
 info@acuite.in
 Follow us
 +91 22 49294000
 DOWNLOAD