KEY TAKEAWAYS
India’s merchandise trade deficit widened to USD 11.0 bn in Jul-21 from USD 9.4 bn in Jun-21, sending signals of a gradual normalization after the second wave of Covid. While both exports and imports gained traction in the month of Jul-21, the relatively higher spurt in inbound shipments resulted in a moderate widening of the trade deficit. We had highlighted in our Jun-21 edition of the "Acuite Macro Pulse” about the possibility of further widening of trade deficit on account of gradual easing of state level lockdowns and lagged impact of elevated international commodity prices.
Looking at the drivers of trade deficit in Jul-21, we find that:
Exports: Clocks a monthly record
In value terms, merchandise exports clocked a monthly record of USD 35.4 bn in Jul-21 (previous monthly record level was seen in Mar-21 at USD 34.7 bn) vis-à-vis USD 32.5 bn in Jun-21, translating into an annualized growth of 49.9% YoY to mark the fifth consecutive month of strong growth.
Imports: At a 4-month high
Merchandise imports jumped to USD 46.4 bn in Jul-21 from USD 41.9 bn in Jun-21, translating into an annualized growth of 63.0% YoY. At a granular level:
Outlook
The widening of the merchandise trade deficit in Jul-21 is predominantly led by the non-core items, viz., oil and precious metals. While both reflect the impact of the phased unlocking of the economy post the second wave of Covid, the former also captures the higher price impact of international crude oil. Meanwhile, despite lower price of gold, rise in import demand could be reflective of seasonality as well as a pickup in inflation perception of households.
From core trade perspective, the buoyancy on exports is comforting. However, core imports still continue to suggest subdued domestic demand conditions, something which the RBI’s MPC has highlighted.
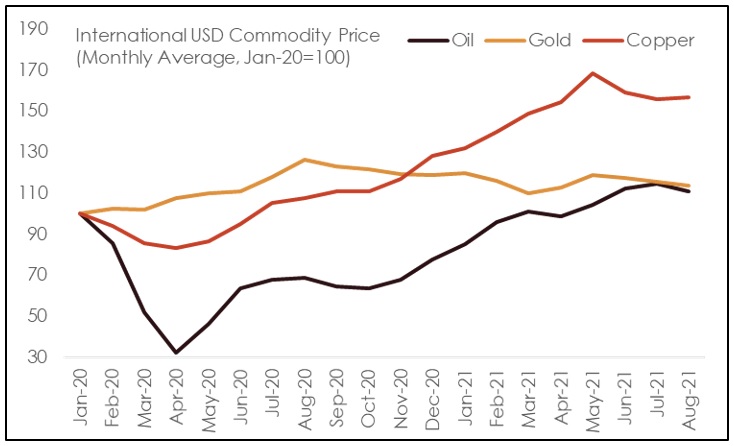
While we continue to expect further widening of trade deficit, we do note that international commodity prices have started to plateau on the back of supply adjustments in case of oil, administrative actions on select commodities by China, and renewed threat of Covid infections (from the Delta variant) in few countries. This could potentially temper the price impact in the coming months..
From a demand perspective, we expect vaccinations to provide a leg up, later in the year with at least 60% of the population being partially inoculated before the end of 2021.
We continue to stick to our FY22 current account estimate of USD 30 bn deficit vis-à-vis a surplus of USD 24 bn estimate in FY21.
Table 1: Key items within merchandise trade balance
| India's merchandise trade highlights (USD bn) | ||||
| Jul-20 |
Jul-21 |
Apr-Jul FY21 | Apr-Jul FY22 | |
| Exports | 23.6 | 35.4 | 74.9 | 130.9 |
| Petroleum Exports | 1.8 | 5.9 | 6.5 | 18.8 |
| Gems & Jewellery Exports | 1.5 | 3.5 | 4.2 | 12.6 |
| Core Exports | 20.4 | 26.1 | 64.2 | 99.4 |
| Imports | 28.5 | 46.4 | 89.5 | 172.5 |
| Petroleum Imports | 6.5 | 12.9 | 19.6 | 43.9 |
| Gems & Jewellery Imports | 2.8 | 6.8 | 5.1 | 22.1 |
| Core Imports | 19.1 | 26.7 | 64.8 | 106.6 |
| Trade Balance | -4.8 | -11.0 | -14.6 | -41.7 |
| Petroleum Trade Balance | -4.8 | -7.0 | -13.1 | -25.1 |
| Gems & Jewellery Trade Balance | -1.3 | -3.4 | -1.0 | -9.4 |
| Core Trade Balance | 1.3 | -0.5 | -0.6 | -7.2 |
Chart 1: Global commodity prices showing signs of plateauing
 +91 99698 98000
 info@acuite.in
 Follow us
 +91 22 49294000
 DOWNLOAD