Jun-21 Trade Balance: A step towards normalization after Covid 2.0
KEY TAKEAWAYS
- India’s merchandise trade deficit widened to USD 9.4 bn from an 8-month low of USD 6.3 bn in May-21.
- It is led by a recovery in imports allowed by the gradual opening up of economy, as value of outbound shipments remained little changed from previous month.
- For Q1 FY22, overall trade deficit stood at USD 30.8 bn, a significant up move compared to USD 9.6 bn over the corresponding period a year ago; but significantly lower when compared to pre-pandemic level of USD 49.2 bn in Q1 FY20.
- From a current account perspective, this means that India will once again switch to a surplus in Q1 FY22 albeit to a much lesser degree in comparison to Q1 of last fiscal year.
- However, amidst rising commodity prices, tapering of state level lockdown stringency, and anticipated ramp up in vaccination in the coming months, we continue to stick to our FY22 current account deficit estimate of approximately USD 30 bn.
India’s merchandise trade deficit widened to USD 9.4 bn from an 8-month low of USD 6.3 bn in May-21, in a fresh attempt towards normalization after the second wave of the Covid pandemic. The deficit expansion was led by a recovery in imports allowed by the gradual unlocking of economy, as the value of outbound shipments remained virtually changed from previous month. Nevertheless, the level of trade deficit still remains lower than the pre-second wave average of USD 13.7 bn recorded over Nov-20 and Apr-21.
On a quarterly basis, for Q1 FY22, overall trade deficit stood at USD 30.8 bn, a significant up move compared to USD 9.6 bn over the corresponding period a year ago; but curtailed when compared to pre-pandemic level of USD 49.2 bn in Q1 FY20. From a current account perspective, this means that India will once again switch to a surplus in Q1 FY22 albeit of a much lesser degree in comparison to Q1 of last fiscal year.
Drivers of trade deficit in Jun-21
In value terms, exports remained nearly unchanged at USD 32.5 bn in Jun-21 versus USD 32.3 bn in May-21. On an annualized basis, export growth at +48.3% YoY marked the fourth consecutive month of strong positive growth.
- The sequential increase was led by exports of Engineering goods (+USD 0.6 bn) and Inorganic/Organic chemicals (+USD 0.5 bn). On the other hand, there was a sequential drop seen in case of non-core exports of Petroleum products (-USD1.3 bn) and Gems and jewellery (-USD 0.14 bn). As such, core exports (i.e., headline ex petroleum and gems & jewellery) rose to USD 25.7 bn in Jun-21, up from USD 24.0 bn in May-21.
- For Q1 FY22, cumulative exports stood at USD 95.4 bn, the highest quarterly run rate on record, compared to USD 51.5 bn in Q1 FY21 and USD 80.9 bn in Q2FY20. The continuity of operations at manufacturing units albeit with restrictions amidst the restrictions and lockdown in months of Apr-21 and May-21, along with gradual opening up of the economy in Jun-21, have helped exports to keep up pace. In addition, stronger rebound in global growth as well as limited global supply chains disruptions compared to last year, continue to provide momentum to exports.
Merchandise imports rose to USD 41.9 in Jun-21 from USD 38.6 bn in May-21, translating into an annualized growth of +98.3% YoY. At a granular level:
- The upside was broad-based, led by oil and Non-oil non-gold imports predominantly.
- Oil imports in the month rose to USD 10.7 bn from USD 9.5 bn in May-21, reflecting the hardening of global crude price by 7.5%MoM in Jun-21 along with an uptick in domestic demand as state level lockdowns eased and mobility of both goods and people picked up.
- Gold imports rose marginally to USD 1.0 bn in Jun-21 from to USD 0.7 bn in May-21, to mark second consecutive month of suppressed levels. Recall, gold imports had averaged at USD 6.0 bn over the months of Jan-Apr-21. The recent moderation can perhaps be seen as a mean reversion post the excessive build up of inventory ahead of the second wave.
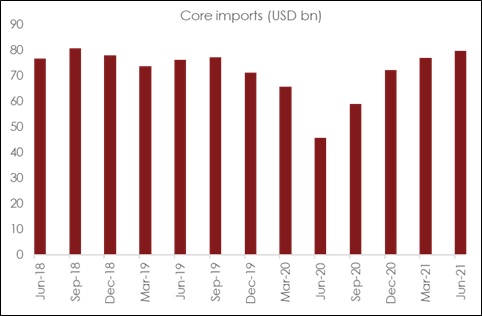
- Overall, core imports (headline ex petroleum and gems & jewellery) rose to a near 3-year high of USD 27.6 bn in Jun-21 compared to USD 26.2 bn in May-21. Core imports have held up well in Q1 FY22, at USD 79.7 bn, higher not just than Q4 FY21 but also pre-pandemic comparable quarter of Q1 FY20 (see chart). This momentum reflects an encouraging pickup in demand amidst gradual unlocking as well as the impact of higher commodity prices.
Outlook
The anticipated surplus on the current account in Q1 FY22 is unlikely to sustain amidst the elevated level of commodity prices. More so, the gradual tapering of lockdown stringency at state level will continue to support revival in economic activity, which would further get a boost from anticipated ramp up in domestic vaccination drive in the coming months. This should lead to a return of the merchandise trade deficit to the normalized levels over the next few months. Hence, we continue to stick to our FY22 current account estimate of approximately USD 30 bn deficit vis-à-vis USD 26 bn estimate in FY21.
Table 1: Key items within merchandise trade balance
| India's merchandise trade highlights (USD bn) |
|
Jun-20 |
Jun-21 |
Q1 FY21 |
Q1 FY22 |
| Exports |
21.9 |
32.5 |
51.5 |
95.4 |
| Petroleum Exports |
1.9 |
4.0 |
4.9 |
12.9 |
| Gems & Jewellery Exports |
1.6 |
2.8 |
2.7 |
9.2 |
| Core Exports |
18.4 |
25.7 |
43.9 |
73.3 |
| Imports |
21.1 |
41.9 |
61.1 |
126.1 |
| Petroleum Imports |
4.93 |
10.7 |
13.2 |
31.0 |
| Gems & Jewellery Imports |
1.4 |
3.6 |
2.3 |
15.2 |
| Core Imports |
14.8 |
27.6 |
45.6 |
79.9 |
| Trade Balance |
0.8 |
-9.4 |
-9.6 |
-30.8 |
| Petroleum Trade Balance |
-3.0 |
-6.7 |
-8.3 |
-18.1 |
| Gems & Jewellery Trade Balance |
0.2 |
-0.7 |
0.4 |
-6.0 |
| Core Trade Balance |
3.6 |
-1.9 |
-1.7 |
-6.6 |
Chart 1: Global commodity prices have seen a sharp run up in last 2-quarters
 +91 99698 98000
 info@acuite.in
 Follow us
 +91 22 49294000
 DOWNLOAD