KEY TAKEAWAYS
India’s industrial production swung wildly, posting a record expansion of 22.4% YoY in Mar-21 from a contraction of 3.4% YoY (revised up from a contraction of 3.6%) seen in Feb-21. To be sure, market expectations were geared towards an exceptionally strong print of 17-20% as per various polls on the back of an extremely favorable statistical base (with commencement of nationwide lockdown depressing the IIP base in Mar-20). However, the magnitude of actual expansion has surprised us on the positive side. Overall, IIP ended Q4 FY21 with a growth of 5.2% YoY, up from 1.7% seen in Q3 FY21. For the year as a whole, IIP expectedly, posted a record contraction of 8.7% in FY21 compared to a mild contraction of 0.8% seen in FY20.
On sequential basis, the IIP expanded by 10.6% MoM in Mar-21, marginally lower than the average (seen in the current data series with 2011-12 as base excluding Mar-20 data on account of the nationwide lockdown) expansion of 11.2% seen in the month of March. Nevertheless, it is fairly in line with the seasonal trend of year end ramp up in production activity.
The Internals: Favorable base effect reflected everywhere
Outlook
The exceptionally strong IIP growth in Mar-21 needs to be seen through the prism of statistical base, which will continue to create outliers for industrial growth over the next five months (IIP growth in Apr-21 is likely to surpass the record print seen in Mar-21 given the negligible industrial output in Apr-20). As a matter of fact, most of the high frequency indicators capturing industrial activity will manifest this trend on annualized basis. Eventually, this would manifest in a record growth in Q1 FY22 GDP for India.
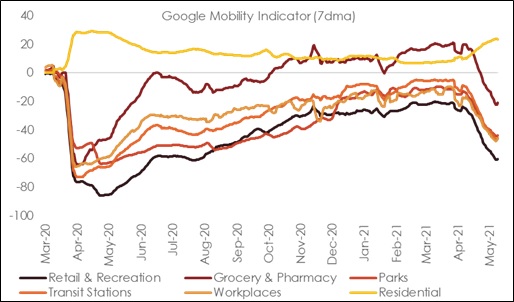
Having said so, we note that the severity of Covid 2.0 is resulting in state level lockdowns getting pervasive and also stringent in May-21 vis-à-vis Apr-21. This has already started to impact daily mobility indicators. The Google Mobility Indicator for various categories is currently down to the subdued levels last seen in May-Jun 2020, i.e., towards the end of the stringent nationwide lockdown phase. In addition, some of the high frequency indicators released so far (automobile sales and GST e-way bills) have started to capture the sequential drop in activity levels in Apr-May 2022. This could potentially snowball into a larger drop in sequential activity since the second wave of Covid is yet to peak out and lockdown restrictions could stay until Jun-21, longer than our previous assumption of May-21. We believe this could then impart some downside risk to our FY22 GDP growth estimate of 10.0%.
Having highlighted the downside to near term growth prospects, we do acknowledge the silver linings as well:
Table 1: Anatomy of IIP growth
|
Weight in IIP |
Mar-20 |
Mar-21 |
FY20 |
FY21 |
|||
|
(%) |
(% YoY) |
(% YoY) |
(% YoY) |
(% YoY) |
|||
|
IIP |
100.0 |
-18.7 |
22.4 |
-0.8 |
-8.7 |
||
| Sectoral Classification | |||||||
|
Mining |
14.4 |
-1.3 |
6.1 |
1.6 |
-7.8 |
||
|
Manufacturing |
77.6 |
-22.8 |
25.8 |
-1.4 |
-9.8 |
||
|
Electricity |
8.0 |
-8.2 |
22.5 |
0.9 |
-0.5 |
||
| Use-Based Classification | |||||||
|
Primary Goods |
34.0 |
-4.0 |
7.7 |
0.7 |
-7.0 |
||
|
Intermediate Goods |
17.2 |
-18.6 |
21.2 |
9.1 |
-9.7 |
||
|
Capital Goods |
8.2 |
-38.8 |
41.9 |
-14.0 |
-19.2 |
||
|
Infrastructure/Construction Goods |
12.3 |
-24.3 |
31.2 |
-3.6 |
-9.0 |
||
|
Consumer Durables |
12.8 |
-36.8 |
54.9 |
-8.8 |
-15.2 |
||
|
Consumer Non-Durables |
15.3 |
-22.3 |
27.5 |
-0.1 |
-2.3 |
||
Chart 1: Most categories of mobility indicators are now down to May-Jun 2020 levels
 +91 99698 98000
 info@acuite.in
 Follow us
 +91 22 49294000
 DOWNLOAD