KEY TAKEAWAYS
India’s IIP growth rose marginally in Mar-22 to 1.9%YoY from 1.5% in Feb-22 (revised lower by 20 bps) to fare slightly better than market consensus pegged at 1.7%. Over the last 5 months, annualised IIP growth has remained in a slow albeit steady range of 1.0-1.9% averaging at a subdued 1.4%. It is possibly due to a combination of an unfavourable base as well as Omicron wave adversely impacting growth momentum in Jan-22. Looking specifically at Mar-22, notwithstanding the subdued headline growth, sequentially IIP posted a strong expansion of 12.5%MoM.
A deep dive into internals
Outlook
Notwithstanding the strong sequential improvement seen in Mar-22, trend growth in IIP has remained subdued over the last few months. Heading into FY23, the pace of recovery could come under threat given the growing headwinds from the likely impact of Russia-Ukraine crisis and slowing global growth. Further, growth is likely to reel under an adverse statistical base with FY22 IIP growth having averaged at a strong 11.4% compared to a contraction of 8.5% in FY21.
Overall, the capex focused government spending, expectation of a normal Southwest monsoon, opening up of the economy post the Omicron wave esp. services are likely to provide support to FY23 growth. We retain our FY23 GDP growth estimate at 7.5% with downside risk.
Annexure-1
Chart 1: Mar-22 IIP surprised above market consensus* for the first time in 5 months
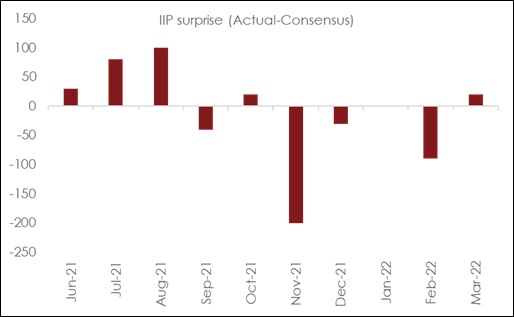
*Source: Refinitiv
| IIP Growth (%YoY): Break-up | |||||||
|
Weight |
Mar-21 |
Mar-22 |
FY21 |
FY22 |
|||
|
IIP Headline |
100.0 |
24.2 |
1.9 |
-8.4 |
11.3 |
||
| Sectoral Classification | |||||||
|
Mining |
14.4 |
6.1 |
4.0 |
-7.8 |
12.2 |
||
|
Manufacturing |
77.6 |
28.4 |
0.9 |
-9.4 |
11.7 |
||
|
Electricity |
8.0 |
22.5 |
6.1 |
-0.5 |
7.9 |
||
| Use-Based Classification | |||||||
|
Primary Goods |
34.1 |
7.9 |
5.7 |
-7.0 |
9.7 |
||
|
Capital Goods |
8.2 |
50.4 |
0.7 |
-18.6 |
16.7 |
||
|
Intermediate Goods |
17.2 |
22.4 |
0.6 |
-9.4 |
15.1 |
||
|
Infrastructure/Construction Goods |
12.3 |
3.5 |
7.3 |
-8.7 |
19.0 |
||
|
Consumer Durables |
12.8 |
59.9 |
-3.2 |
-15.0 |
12.5 |
||
|
Consumer Non-Durables |
15.3 |
29.2 |
-5.0 |
-2.2 |
3.2 |
||
 +91 99698 98000
 info@acuite.in
 Follow us
 +91 22 49294000
 DOWNLOAD