KEY TAKEAWAYS
India’s IIP growth eased to 29.3%YoY in May-21 from a lofty 134.6% in Apr-21, broadly in line with market expectations. The substantial moderation in the numerical print was a consequence of a waning favourable base from last year’s stringent nationwide lockdown in Apr-20.
The double-digit acceleration actually conceals a material contraction in sequential momentum of 8.0%MoM in May-21, reflecting the impact of state level lockdowns that turned pervasive in the month. Barring the pandemic year of 2020, this is the first sequential contraction seen in the month of May in the 2011-12 based IIP series. The weak momentum was in line other high frequency data, such as that of core sector, fuel consumption, tractor and auto production among others. Recall, the month had also seen temporary production closures at several automobile plants, amidst safety concerns and pile up of inventories as well as dealership shutdowns. Further, the diversion of industrial oxygen for medical purposes may have also weighed on select sectoral output (such as in consumer durables, steel among others).
Outlook
In our last IIP report, we had highlighted the possibility of a further sequential slowdown in May-21 coinciding with the peak of the healthcare crisis brought about by the second Covid wave. While this pulled down the annualised growth figures for May-21 IIP, the push from a favourable statistical base ensured that it still remained elevated in double-digits. This is likely to continue into Jun-21 as well, and hence highlights the need to interpret Q1 FY22 year-on-year data carefully and also look at the sequential data simultaneously.
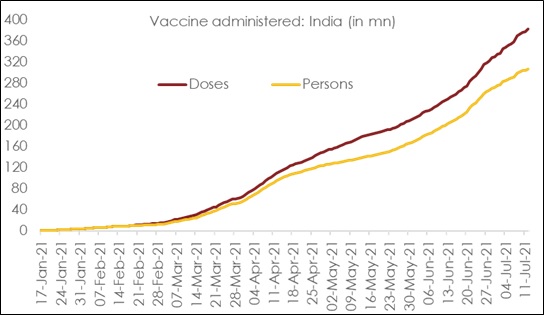
Growth momentum has seen a decisive turnaround in Jun-21, led by pick up in mobility and economic activity as validated by several high frequency indicators. However, uncertainty with respect to slowdown in pace of vaccinations and a "break” in rainfall activity have risen lately.
The other silver lining in the form of strong support from global economic growth to domestic exports and an accommodative policy backdrop (both monetary and fiscal) should further aid sequential recovery in industrial activity. Having said so, subsequent IIP readings could show some degree of volatility in Q2 FY22, before stabilizing in H2 FY22. We continue to track these developments along with the continuing high level of infections in select states that highlight the potential risks of another wave. We continue to stick to our FY22 GDP growth forecast of 10.0% albeit with some downside risk.
Annexure-1
Table 1: Anatomy of IIP growth
|
Weight in IIP |
Apr-21 |
May-21 |
May-21 |
||||
|
(%) |
(% YoY) |
(% YoY) |
(% MOM) |
||||
|
IIP |
100.0 |
134.6 |
29.3 |
-8.0 |
|||
| Sectoral Classification | |||||||
|
Mining |
14.4 |
36.3 |
23.3 |
0.6 |
|||
|
Manufacturing |
77.6 |
197.9 |
34.5 |
-9.5 |
|||
|
Electricity |
8 |
38.5 |
7.5 |
-7.0 |
|||
| Use-Based Classification | |||||||
|
Primary Goods |
34 |
36.8 |
15.8 |
-2.9 |
|||
|
Intermediate Goods |
17.2 |
212.3 |
55.2 |
-6.7 |
|||
|
Capital Goods |
8.2 |
1042.9 |
85.3 |
-18.0 |
|||
|
Infrastructure/Construction Goods |
12.3 |
596.1 |
46.8 |
-8.1 |
|||
|
Consumer Durables |
12.8 |
1880.0 |
98.2 |
-27.7 |
|||
|
Consumer Non-Durables |
15.3 |
94.9 |
0.8 |
-3.7 |
|||
Table 2: ItemWise sequential performance in May-21 over Apr-21
|
Worst Performers |
Best Performers |
|
Water purification apparatus |
Acetic Acid |
|
Air conditioners (ACs) |
Aniline |
|
Timber Sawn, Wooden Planks |
Fruit Pulp |
|
Ammonium sulphate |
Sugar Machinery |
|
Musical instruments |
Vaccine for veterinary medicine |
|
Sugar |
Non-electric heating cooking appliances |
|
Anti-malarial drugs |
Phosphoric acid |
|
Stainless steel tanks (incl. fuel tanks) |
Diammonium Phosphate (DAP) |
|
Plastic furniture |
Medicated shampoos |
|
Refrigerators for domestic use |
Methanol |
Chart 1: Nearly 23% of India’s population has been inoculated with single-dose
 +91 99698 98000
 info@acuite.in
 Follow us
 +91 22 49294000
 DOWNLOAD