Impact Analysis: Monsoon Update FY20 – July 2019
Brief:We note an interesting trend pertaining to the dynamic change in farmer sowing strategy in much of India. While area under sown for food grain such as rice, pulses and cereals has been falling, that for cotton, oilseeds and sugar cane has gone up. From an inflation perspective, lower area under sown for food grain (54.9%) indicates a sharp uptick in food inflation rate in the coming months.
South-west monsoon has recorded average 368 mm rainfall across India as on July 29, 2019. This is (- )13% lower than the long-term average (LTA) of 424 mm. The rainfall distribution seems to be skewed in the favor of limited areas. Only 22 states have received normal or above normal rainfall. On the other hand, rainfall in 14 states is in deficit.
The major agricultural states that are experiencing deficit rainfall are Haryana, Telangana, Tamil Nadu, Odisha, Chhattisgarh, West Bengal, Jharkhand, and Kerala. Among these states, West Bengal, Jharkhand, and Gujarat have received rainfall less than (-) 30% of normal rainfall. Therefore, area under sown in these states is unlikely to gather pace in the remaining months. Consequently, the area under sown is expected to remain far below the long-term average among these effected states.
On a sub-division India level, 55% of sub-divisions have received below normal rainfall (47% deficit and 8% large deficit). Similarly, 12% of sub-divisions have received excess rainfall.
The skewed rainfall distribution has been adversely impacting sowing of all crops including rice, pulses, and oilseeds except for sugar cane and cotton. With a normal monsoon in Maharashtra (at par with LTA) and Uttar Pradesh (only -1% lower than LTA), area under sown for sugar cane and cotton is in a good stead. So far, actual area sown under sugar cane is 108% of the normal area sawn – like the previous year’s trend. It is known that the sugar cane production has reached a record high of 400 million tons during the previous crop cycle. A similar trend is expected in FY20 as well.
We note an interesting trend pertaining to the dynamic change in farmer sowing strategy in much of India. While area under sown for food grain such as rice, pulses and cereals has been falling, that for cotton, oilseeds and sugar cane has gone up. To a certain extent, this initial trend shows that Indian agriculture sector has been shifting from food grain production to commercial crops.
From an inflation perspective, lower area under sown for food grain (54.9%) indicates a sharp uptick in food inflation rate in the coming months. It is worth mentioning that food inflation has remained low over the past two years (1.80% in FY18 and 0.14% in FY19) and situation has proved to be a leverage for the RBI to maintain an accommodative monetary stance. It is worth noting that the persistently low food inflation over the past two years is attributed to lower price level of vegetables, pulses and sugar. The ongoing status of area under sawn for food grain is therefore indicating that pulses, cereals and vegetables are expected to lead the overall inflation rate in FY20 and FY21 – opposite to their deflationary tendencies previously.
|
|
Actual area sown as % of normal area sown |
% change over previous year |
||||
|
Crops |
2017 |
2018 |
2019 |
2017 |
2018 |
2019 |
|
Overall |
74.94 |
69.58 |
64.76 |
4.72 |
-7.2 |
-6.44 |
|
Food grain |
69.6 |
61.8 |
54.94 |
5.68 |
-10.91 |
-10.01 |
|
Cereals |
62.84 |
56.2 |
52.02 |
4.97 |
-11.17 |
-7.35 |
|
Rice |
56.98 |
49.98 |
46.72 |
6.74 |
-12.37 |
-6.35 |
|
Coarse cereals |
74.92 |
69.25 |
63.17 |
2.32 |
-9.29 |
-8.87 |
|
Pulses |
107.26 |
90.99 |
69.16 |
8.04 |
-10.06 |
-18.58 |
|
Sugar cane |
99.34 |
110.79 |
108.24 |
9.95 |
11.52 |
-5.68 |
|
Oilseeds |
77.36 |
76.51 |
73.45 |
-8.5 |
-1.03 |
-5.16 |
|
Cotton |
90.96 |
85.61 |
90.09 |
20.63 |
-7.96 |
6.28 |
Source: Acuité Research, CMIE
Rainfall Distribution Map (Until July 29, 2019):
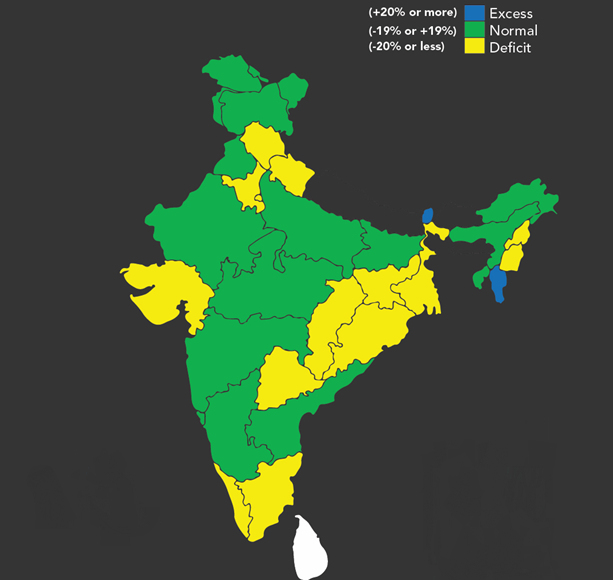
Source: Acuité Research, IMD
 +91 99698 98000
 info@acuite.in
 Follow us
 +91 22 49294000
 DOWNLOAD