KEY TAKEAWAYS
Reversing two consecutive months of gain, India’s industrial production contracted in Nov-20, with annualized print coming in at -1.9% vis-à-vis 4.2% in Oct-20. The loss in momentum is broadly in line with other high frequency indicators for Nov-20, like the Core Infrastructure Index, Automobile Production, Fuel Consumption, and the survey-based PMI-Manufacturing, all of which saw a moderation vis-à-vis the previous month.
Factors behind the decline
Since IIP data is not adjusted for working day effect, the same becomes a source of volatility, especially during festive heavy months. The month of November marks the end of the usual festive heavy season in India (that captures key holidays on account of Dussehra, Diwali, etc.). In 2020, the month of November had fewer working days compared to that in 2019. Hence, this could have resulted in temporary loss in production volumes.
Few industries (like automobiles) had seen a rapid build-up of inventories in the ongoing unlock phase. Hence, some breather was expected.
Topography of decline
The loss in momentum in Nov-20 appears to be broad based from both sectoral as well as use-based classification. Both consumptions focused indicators (consumer durables as well as non-durables) and investment proxy indicators (capital goods and infrastructure/construction goods) weakened vis-à-vis the previous month.
Outlook
Notwithstanding the subdued industrial activity in Nov-20, we would refrain from any extrapolation as we believe that there is still a lot of room to catch up post the temporary but sharp shock witnessed on account of stringent lockdown restrictions imposed during Apr-May FY21.
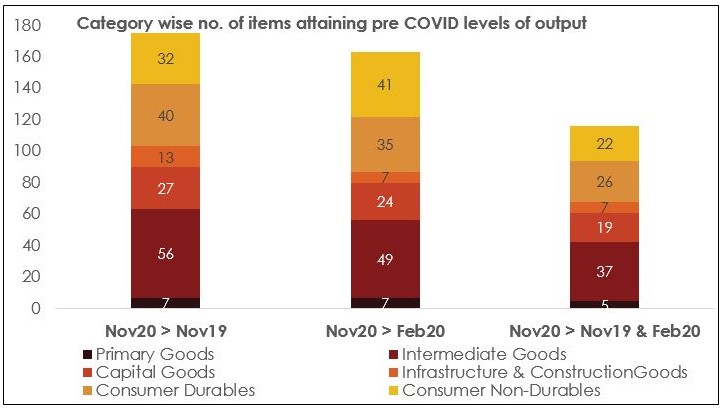
At a granular level, we note that recovery vis-à-vis pre pandemic levels is progressing well with 175 items out of the total IIP basket of 407 items exceeding their output volume in Nov-20 vis-à-vis Nov-19 levels. Similarly, 163 items have exceeded their output volume in Nov-20 vis-à-vis Feb-20 levels. Bulk of the items showing improvement fall under the category of intermediate goods, consumer non-durables, and consumer durables. With consumer goods leading the recovery, it possibly highlights the outsized role of pent-up demand playing in the recent phase of recovery.
However, this does not imply that investment-oriented sectors are lagging far behind. The full sample correlation between growth in production of investment goods and consumer goods stand at a strong 94%. In addition, organic growth in overall industrial activity would proceed further as:
Table 1: Key highlights of IIP data
|
Weight in IIP |
Nov-19 |
Nov-20 |
Apr-Nov FY20 |
Apr-Nov FY21 |
|
|
(%) |
(% YoY) |
(% YoY) |
(% YoY) |
(% YoY) |
|
|
IIP |
100.0 |
2.1 |
2.1 |
0.3 |
-15.5 |
| Sectoral Classification | |||||
|
Mining |
14.4 |
1.9 |
-7.3 |
-0.1 |
-12.5 |
|
Manufacturing |
77.6 |
3.0 |
-1.7 |
0.4 |
-17.3 |
|
Electricity |
8.0 |
-5.0 |
3.5 |
0.8 |
4.6 |
| Use-Based Classification | |||||
|
Primary Goods |
34.0 |
-0.2 |
-2.6 |
0.1 |
-11.3 |
|
Intermediate Goods |
17.2 |
17.2 |
-3.0 |
10.3 |
-17.2 |
|
Capital Goods |
8.2 |
-8.9 |
-7.1 |
-11.7 |
-31.1 |
|
Infrastructure/Construction Goods |
12.3 |
-0.7 |
0.7 |
-2.4 |
-17.7 |
|
Goods |
17.2 |
17.2 |
-3.0 |
10.3 |
-17.2 |
|
Consumer Durables |
12.8 |
-1.4 |
-0.7 |
-6.6 |
-28.1 |
|
Consumer Non-Durables |
15.3 |
1.1 |
-0.7 |
3.5 |
-5.4 |
Chart 1: 40-43% of items within IIP have exceed their pre COVID levels of production
 +91 99698 98000
 info@acuite.in
 Follow us
 +91 22 49294000
 DOWNLOAD