KEY TAKEAWAYS
India’s IIP growth in Nov-21 slipped to the lowest level in 9-months, coming in at 1.4%YoY compared to 4.0% in Oct-21. The outcome was weaker than market expectations which were pegged at around 2.9%.
Key granular details
Outlook
Going by the recovery seen in most lead indicators in the month of Dec-21, it can be expected that IIP growth too may partly bounce back next month. Having said so, growth prospects for Q4 FY22 remain clouded amidst the fast spread of Omicron cases in the country that have led to the reimposition of restrictions at the state-level. So far, the bulk of impact has been on consumer mobility and contact service sectors in particular, with high frequency indicators such as e-way bills, railway freight and electricity generation having held up well. While it is still early to make a strong conclusion, the indications are that the latest wave will entail lower/minimal restrictions on industrial and export related activities.
In addition, the international evidence which points to Omicron variant being less virulent and resulting in lower hospitalization rate, offers hope. Further, India has made reasonable progress on vaccination with 69% of the adult population being fully vaccinated, which has now been opened up for 15-18 years old as well. In addition, monetary and fiscal policies remain broadly supportive.
On the downside, adverse spillover from domestic and global lockdowns prolonging supply side disruptions, elevated commodity prices and potential financial market volatility on account of monetary policy normalization by key global central banks could weigh on industrial recovery.
Annexure-1
Chart 1: Breadth of recovery for manufacturing sub-sectors deteriorates in Nov-21
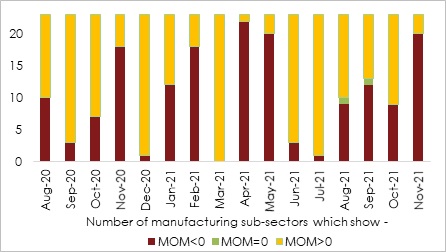
Table 1: IIP growth at a glance
| IIP Growth (%YoY): Break-up | |||||||
|
Weight |
Sep-21 |
Oct-21 |
Nov-21 |
||||
|
IIP Headline |
100 |
3.3 |
4.0 |
1.4 |
|||
| Sectoral Classification | |||||||
|
Mining |
14.4 |
8.6 |
11.5 |
5.0 |
|||
|
Manufacturing |
77.6 |
3.0 |
3.1 |
0.9 |
|||
|
Electricity |
8.0 |
0.9 |
3.1 |
2.1 |
|||
| Use-Based Classification | |||||||
|
Primary Goods |
34.1 |
4.6 |
9.0 |
3.5 |
|||
|
Capital Goods |
8.2 |
2.4 |
-1.5 |
-3.7 |
|||
|
Intermediate Goods |
17.2 |
5.0 |
3.8 |
2.5 |
|||
|
Infrastructure/Construction Goods |
12.3 |
7.8 |
6.6 |
3.8 |
|||
|
Consumer Durables |
12.8 |
-1.9 |
-3.6 |
-5.6 |
|||
|
Consumer Non-Durables |
15.3 |
0.2 |
0.9 |
0.8 |
|||
 +91 99698 98000
 info@acuite.in
 Follow us
 +91 22 49294000
 DOWNLOAD