While considering non-service trade, US – India business has been recording consistent growth over the years, especially since the start of the Donald Trump era. After reaching an absolute nadir post India’s Pokhran Nuclear Tests in 1998, relations between the two countries have been somewhat restored. Great efforts have gone into curating the rapport between the two countries and the culmination of it all lies in US’s share in total Indian trade breaching the 10% mark in FY19 itself.
The current warmth began during the tenure of President George Bush Junior, further built by President Barack Obama - ultimately evolving into a full-fledged strategic partnership. The induction of India into the Nuclear Suppliers Group (NSG) as well as Missile Technology Control Regime (MTCR), on the behest of the US – without signing the entry barrier, Nuclear Non-proliferation Treaty (NPT) are strategic yardsticks, dictating this very evolution. As a major trading partner, US is perhaps the only large trader with India (apart from some countries in the EU), with which India enjoys a lucrative trade surplus, currently valued at over $17 billion.
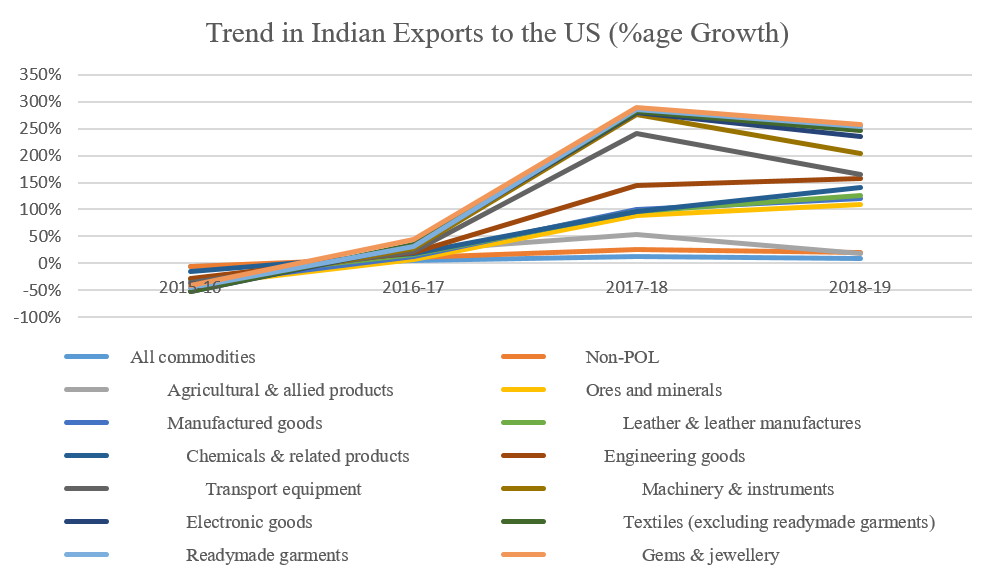
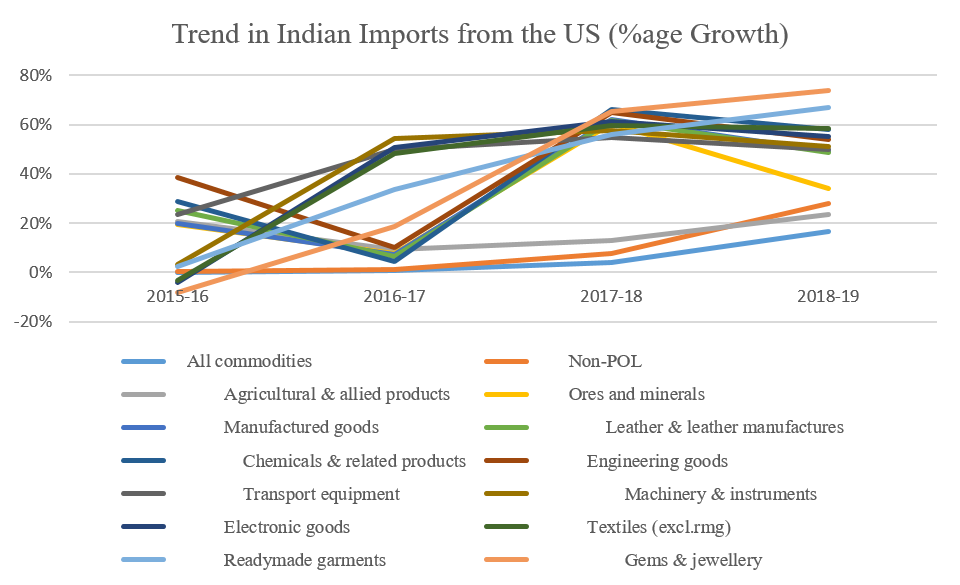
Since the start of President Trump’s tenure in the year 2017, the US-India trade (excluding services) has expanded by 33%, currently standing at nearly $88 billion (end FY19). Exports, driven by Manufactured Goods, Chemicals & Allied, Engineering and Gems & Jewellery have grown by 24%, 16%, 70% and 8% respectively. Imports on the other hand, primarily driven by Manufacturing has expanded by 40%. Meanwhile, Engineering Goods (mainly Capital Goods & Defence items), which are almost 22% of total imports from the US have contracted by 14% on the back of poor capex and investment cycle as well as work in progress status.
In the entire statistic, the most interesting number however pertains to exponential growth recorded by the imports of Ore and Minerals from the US. The category has expanded by 289%. We reckon this to be connected with the emergence of the US as a major oil and coal exporter (post the shale gas revolution) to India and other parts of Asia. This has also got to do with the arm twisting negotiation tactics from the American side.
When it comes to ITES related exports, US continues to be the top destination of Indian software and related knowledge based services, contributing to nearly 66% of entire such exports. Currently valued at around $92 billion, India’s IT related exports to the US are expected to reach $115 billion by the year 2025. With a strategic partnership now involving high end AI and cognitive related joint campaigns, the value added would be much higher as we move forward – potentially taking Indian IT exports to America near the double ton mark in less than a decade.
Future Tense
As strategic partners, the next logical step in the US-India trade relation pertains to the intermingling of supply chains. In the wake of the US-China trade war and the recent Coronavirus epidemic, American corporations are seriously looking at the China +1 strategy and India perfectly fits the bill given its comparable captive customer base along with a more competitive wage & tax rate. The modernization and rapid development of infrastructure and logistic chains are however imperative for the vision to take shape.
Defence ties are the other cornerstone of the strategic relations between the two democracies. Shared values between two powers generally comes with interoperability of defence platforms such as military aircrafts, missile systems and naval vessels; consequently, new levels of cooperation have been achieved over the years. Since the beginning of the current ties towards the end of President George Bush Junior’s tenure, India has already imported nearly $15 billion worth of defence equipment from major US defence contractors such as Lockheed Martin, Boeing, GE and General Dynamics. The 30% offset clause in such deals is allowing US contractors to invest significant portion of the deal amount in creating Indian subsidiaries, which are in turn part of their respective global supply chains. As an instance, India’s order of 22 + 6 Apache Attack helicopters for the Indian Air force and Army, respectively, has allowed Boeing to manufacture the airframes of these helicopters out of the Hyderabad facility of the Tata Boeing Joint Venture. More such high value deals are expected to amplify this corporation further into a mutually symbiotic military relationship.
India on the other hand has to open its agro & allied market to US companies, which is a major bone of contention between the two. India wishes to counter by negotiating the H1B quota, which will benefit its professionals and help its case of dollar based remittances. For record, India’s agro & allied trade with the US is roughly $6.3 billion and has been showing contractionary trends after expanding in double digits in the previous year. Unabated agro based trade exposes vulnerable farmers to global vagaries and competition – facts with which developing countries such as India are not willing to come in terms with at the moment. As we move forward, negotiations will continue and possible solutions may be sought pertaining to these contentious issues. Nevertheless, a bigger trade deal may be on the horizon that would ultimately create a large free trade area (or with substantial preferential treatment) between the two economic powers. Having said that, while the possibility of such a deal seems eminent, the timelines are still vague, nonetheless.
|
India’s Exports to US (USD Million) |
2014-15 |
2015-16 |
2016-17 |
2017-18 |
2018-19 |
|
All commodities |
42,441 |
40,313 |
42,189 |
47,887 |
52,459 |
|
Non-POL |
38,600 |
38,244 |
40,321 |
45,313 |
50,058 |
|
Agricultural & allied products |
4,271 |
3,218 |
3,647 |
4,645 |
4,587 |
|
Ores and minerals |
55 |
49 |
41 |
56 |
106 |
|
Manufactured goods |
33,877 |
34,520 |
36,262 |
40,242 |
44,932 |
|
Leather & leather manufactures |
762 |
830 |
861 |
841 |
884 |
|
Chemicals & related products |
6,438 |
7,436 |
7,539 |
7,549 |
8,717 |
|
Engineering goods |
7,624 |
6,632 |
6,841 |
10,021 |
11,622 |
|
Transport equipment |
1,531 |
1,416 |
1,437 |
2,843 |
3,070 |
|
Machinery & instruments |
2,540 |
2,292 |
2,416 |
3,271 |
4,555 |
|
Electronic goods |
1,198 |
1,099 |
1,163 |
1,197 |
1,570 |
|
Textiles (excluding readymade garments) |
3,362 |
3,404 |
3,471 |
3,563 |
3,924 |
|
Readymade garments |
3,618 |
3,867 |
3,747 |
3,864 |
4,163 |
|
Gems & jewellery |
8,368 |
8,626 |
9,679 |
10,019 |
10,408 |
|
India’s Imports from US (USD Million) |
2014-15 |
2015-16 |
2016-17 |
2017-18 |
2018-19 |
|
All commodities |
21,819 |
21,797 |
22,307 |
26,621 |
35,564 |
|
Non-POL |
20,858 |
20,992 |
21,137 |
24,422 |
30,249 |
|
Agricultural & allied products |
993 |
1,199 |
1,458 |
1,836 |
1,659 |
|
Ores and minerals |
559 |
554 |
530 |
1,685 |
2,059 |
|
Manufactured goods |
18,813 |
18,861 |
18,555 |
19,953 |
25,941 |
|
Leather & leather manufactures |
20 |
21 |
21 |
20 |
20 |
|
Chemicals & related products |
2,948 |
3,061 |
2,882 |
3,485 |
4,143 |
|
Engineering goods |
7,020 |
7,720 |
8,918 |
8,355 |
7,674 |
|
Transport equipment |
2,671 |
2,253 |
4,600 |
2,424 |
2,218 |
|
Machinery & instruments |
187.2 |
148 |
164.8 |
186.4 |
191.4 |
|
Electronic goods |
2,784 |
2,577 |
2,328 |
2,744 |
2,978 |
|
Textiles (excl.rmg) |
170 |
172 |
161 |
147 |
156 |
|
Readymade garments |
8 |
9 |
6 |
5 |
5 |
|
Gems & jewellery |
2,739.80 |
2,438.50 |
1,472.70 |
2,124.10 |
2,423.00 |
|
India-US Trade balance (USD Million) |
|
||||
|
All commodities |
20,622 |
18,516 |
19,881 |
21,266 |
16,894 |
|
Non-POL |
17,743 |
17,253 |
19,184 |
20,891 |
19,809 |
|
Agricultural & allied products |
3,279 |
2,018 |
2,189 |
2,808 |
2,928 |
|
Ores and minerals |
-504 |
-504 |
-489 |
-1,630 |
-1,953 |
|
Manufactured goods |
15,064 |
15,658 |
17,707 |
20,289 |
18,992 |
|
Leather & leather manufactures |
742 |
809 |
841 |
821 |
863 |
|
Chemicals & related products |
3,490 |
4,376 |
4,657 |
4,064 |
4,574 |
|
Engineering goods |
604 |
-1,089 |
-2,078 |
1,666 |
3,948 |
|
Transport equipment |
-1,140 |
-837 |
-3,164 |
420 |
852 |
|
Machinery & instruments |
2,353 |
2,144 |
2,251 |
3,085 |
4,364 |
|
Electronic goods |
-1,586 |
-1,478 |
-1,165 |
-1,547 |
-1,409 |
|
Textiles (excl.rmg) |
3,191 |
3,232 |
3,310 |
3,416 |
3,768 |
|
Readymade garments |
3,609 |
3,858 |
3,741 |
3,859 |
4,158 |
|
Gems & jewellery |
5,628 |
6,187 |
8,206 |
7,895 |
7,985 |
 +91 99698 98000
 info@acuite.in
 Follow us
 +91 22 49294000
 DOWNLOAD