Acuité notes that there has been a moderate recovery in the overall industrial activity as reflected in the pickup in IIP from the lows that it had touched in April 2020. There has been a progressive decline in the year on year (YoY) IIP contraction print from 33.9% in May and 16.6% in June to 10.4% in July 2020. On a month on month (MoM) basis, however, the IIP growth stood at 8.8% as compared to 21.7% in the previous month. Clearly, the pace in industrial revival has slowed down in July due to the continuing severity of the pandemic and the intermittent local lockdowns. While the uptick in rural consumption is visible in the production of the consumer non-durable (FMCG) goods, any meaningful revival is yet to be seen in most of the other sectors.
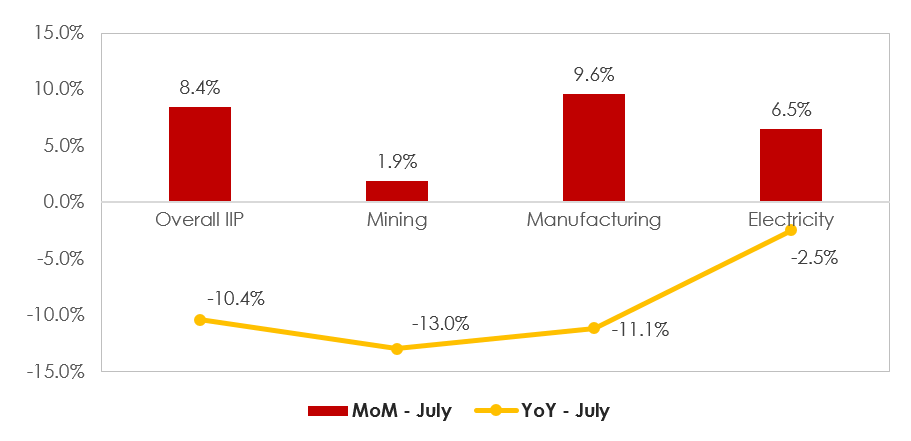
The key component of IIP, the manufacturing sector which constitute 78% of the index is still lower by 11.1% on a YoY basis in July and while it had moved up sharply on a MoM basis to 29.7% with the unlocking of the economy in June, it slowed down to 9.6% in July, reflecting the impact of continued supply disruptions and also weaker demand. The mining activities have also been on a low key with production in July lower on a YoY basis by 13%; typically, the lower print in mining in the second quarter of the year is also linked to the monsoon related disruption. However, the electricity sector raked in a better performance with a YoY contraction of only 2.5% in July and a MoM growth of 6.5%. We believe that a relatively better revival in electricity generation doesn’t indicate a strong revival in industrial activity as yet as much as it indicates higher household demand arising from increasing electrification in the rural areas and higher usage in agricultural sector.
From the use based perspective, almost all the segments continued with their contractionary trend YoY albeit the extent of contraction has been on a decline. Consumer non-durables (FMCG) is the only segment where a positive YoY growth of 6.7% has been witnessed in July. In our opinion, this highlights the improvement in consumption demand in rural areas which has benefitted from a healthy agricultural growth and a favourable monsoon. With a contraction of 22.8%, capital goods continue to remain the worst effected from the crisis. The latter sector, however has been on a secular decline for the last few years and since July 2019, the latter print has been largely below the mark of 100.0, highlighting a structural weakness in private capital expenditure. However, a moderate recovery has started to be visible in intermediate and infrastructure goods which has grown by 16.9% and 9.6% in July over the previous month primarily due to a step up in public investments.
Our further analysis on the individual manufacturing sectors indicates that a few of them such as machinery, electrical equipment, automobiles, wearing apparel, furniture and paper are significantly lagging behind in the revival trajectory with the YoY contraction in excess of 20%. The slow revival is not only due to lackluster demand in the pandemic scenario but also on account of issues of labour availability particularly in apparel and furniture segment. Clearly and understandably, one sector that has stood apart in this lockdown period is the pharmaceutical sector where the production has actually grown YoY @22.0% driven by both higher domestic and export demand in some therapeutic segments. The chemicals sector has performed relatively well with a YoY contraction print only at 3.5% and further, basic metal production including steel and aluminum has seen a moderate revival where the contraction halved to 10.5% in July 2020. While we expected food processing sector to perform better in the current year due to its status of essential goods and healthy crop output, the continuing contraction (4.6% in July) vis-à-vis last year highlights supply side and possibly labour challenges.
Overall, the industrial engine of the economy appears to be making a gradual recovery with a decline in the contractions on a YoY basis. The challenge before the economy, however, is the speed of the revival on a MoM basis. A slower revival can not only push the annual GDP of FY21 deeply into a contraction domain but also have implications on employment and also banking sector asset quality. As the severity of the pandemic tapers down and the intensity of lockdowns eases hopefully over the next few months, the economy will also need some booster doses of fiscal support to emerge out of the pandemic tunnel.
Graph 1: IIP Trajectory – Key Components: July 2020
Table 1: YoY Growth in industrial production by economic activity
|
|
IIP |
Mining |
Manufacturing |
Electricity |
|
Mar-20 |
-18.67 |
-1.28 |
-22.82 |
-8.24 |
|
Apr-20 |
-57.63 |
-26.99 |
-67.12 |
-22.96 |
|
May-20 |
-33.90 |
-20.53 |
-38.44 |
-14.87 |
|
June-20 |
-16.63 |
-19.81 |
-17.13 |
-10.02 |
|
July-20 |
-10.40 |
-13.00 |
-11.10 |
-2.50 |
Table
2: YoY Growth in industrial production by usage
|
|
Primary goods |
Capital goods |
Intermediate goods |
Infra/ Construction |
Consumer Durable |
Consumer |
|
Mar-20 |
-4.00 |
-38.79 |
-18.59 |
-24.32 |
-36.83 |
-22.29 |
|
Apr-20 |
-26.63 |
-92.62 |
-65.40 |
-84.74 |
-95.99 |
-48.64 |
|
May-20 |
-19.71 |
-65.16 |
-40.63 |
-40.69 |
-69.43 |
-11.08 |
|
June-20 |
-14.55 |
-36.9 |
-25.13 |
-21.27 |
-35.5 |
13.99 |
|
July-20 |
-10.90 |
-22.80 |
-12.50 |
-10.60 |
-23.60 |
6.70 |
 +91 99698 98000
 info@acuite.in
 Follow us
 +91 22 49294000
 DOWNLOAD