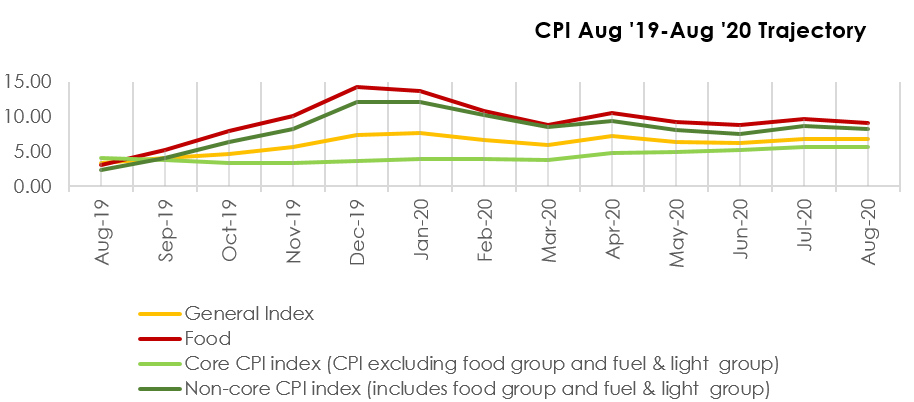
The CPI for August 2020 doesn’t indicate any major relief from the inflationary pressures with the print at 6.69% as against the revised figure of 6.73% in July. Consumer Food Product Index (CPFI) inflation hasn’t shown much of a decline, staying put at 9.0% and highlighting the continuing supply constraints in the economy. Clearly, a double digit inflation in some of these key food categories before the festive season will remain a concern for the policy makers. Core inflation also continues to remain above 5% due to cost push pressures and reinforces the potential risks of stagflation in a contractionary economy, as highlighted earlier by Acuité Ratings. The continuing concerns on inflation and higher fiscal deficit will lead to an extended pause on rate cuts and even increase the bond yields from the current levels despite the deployment of liquidity and yield management tools by RBI.
Clearly, food inflation continues to shape the CPI print trajectory with food and beverages having a weight of 45.9% in the overall index. F&B inflation has slightly dipped from 8.5% in July to 8.3%; if we look at CFPI as quoted by MoSPI which excludes the non-alcoholic beverages and ready to eat foods from the F&B basket, the print has similarly, dropped modestly from 9.27% in July to 9.05% in August. The persistently high levels of food inflation despite good crop output in successive seasons and a favourable monsoon reinforces the significant supply constraints that continue to impact retail food prices. In our opinion, the practice of home delivery of food adopted in a big way in the major urban areas may have also led to an uptick in retail prices. There has only been a slight moderation in the YoY double digit inflation of meat and fish (16.5%) and pulses (14.4%) while it has remained at the same levels for edible oils (12.4%) and vegetables (11.4%). The latter prices often witness significant volatility due to unseasonal rains in the catchment area as has been the case with onions recently, a factor that is yet to get reflected in the CPI. Nonetheless, we expect food inflation to moderate towards the end of the calendar year primarily due to the effect of a favourable base. The inflationary trend in food prices had picked up pace particularly over the four month period August-December last year at an annualised rate of 18.7% and the YoY inflation can be expected to come down provided some of the existing current supply constraints ease before the festive season.
Our primary concern, however remain the core inflation (excluding food and fuel and light basket) which has inched up YoY almost 100 bps from 4.72% in April 2020 to 5.62% in August 2020. Typically, a prolonged period of higher food inflation can lead to cost push pressures on other goods and services even in a weak demand scenario and pull up core inflation. There are two major components in higher core inflation in the current year – transport and communication as well as personal care products. While global crude prices have sharply dropped by 28% from around USD 60 a barrel (Aug 2019) to USD 43 a barrel (Aug 2020) over the last one year, the retail prices of petrol and diesel have spiked by 12%-14%, reflecting the impact of sharply higher excise duties on fuel imposed by the government to bridge the revenue shortfall. Further, telecom tariffs have also seen a rise of 16% triggered by the consolidation in the industry. In the personal care basket, the 45% yoy surge in prices of gold, an important product for Indian households has also continued to contribute to inflation.
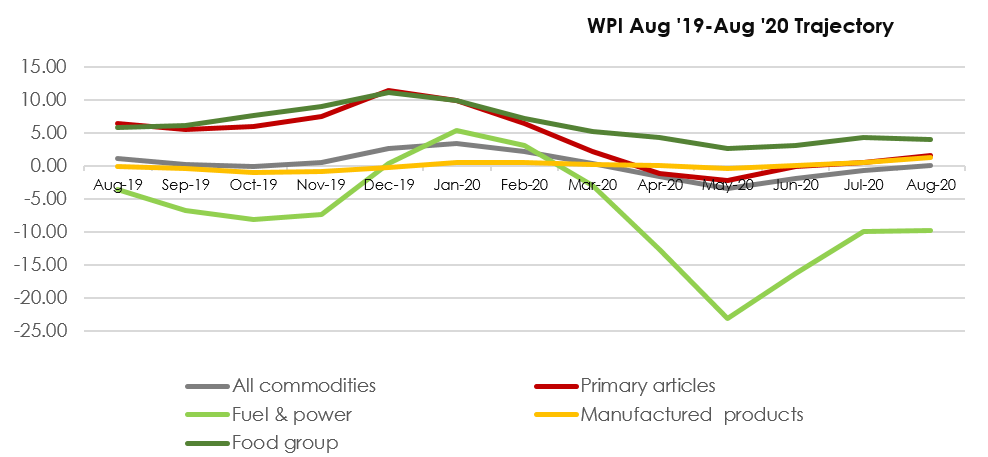
The latest August 2020 WPI print which has just entered inflationary trajectory (0.16% YoY) is an added concern on the inflation front. As with the CPI, the WPI is also largely driven by the food basket, which by weight comprises 24.4% of the index. It is noted that the food article basket continued to remain in expansion mode during the entire lock down period i.e. the food index grew by 7.2% in March- August period while the overall index has expanded by only 1.1%. What this means is that price pressures in food category continued to be transmitted from the wholesale level unabated, irrespective of consumer demand at the retail level. We also note that the price index of manufactured products, which is 64.2% by weight started to expand in August implying improving demand at the production/ wholesale level.
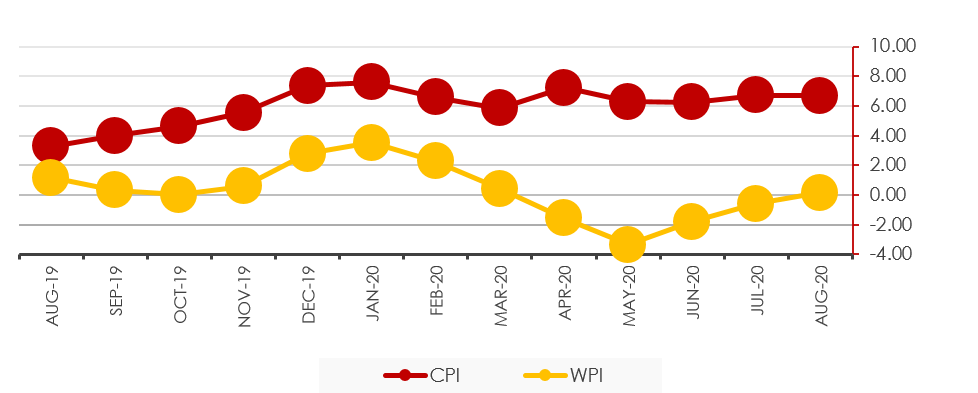
While the differential between CPI and WPI has narrowed down to 653 bps in August as compared to a multi-year high of 964 bps witnessed in May, such high differential is a sign of significant discrepancies between wholesale and retail prices, which are typically caused by supply chain disruptions. A prolonged situation of this kind may negatively impact the system efficiencies and worsen the crisis.
Given the fact that the August sample size of data
collected is almost equivalent to pre-Covid levels, the numbers do reflect the
true picture of the inflationary tendencies. It now remains to be seen when the
WPI/ CPI differential normalizes and whether it is guided by food inflation or the
core category in the near term.
Source: CMIE
 +91 99698 98000
 info@acuite.in
 Follow us
 +91 22 49294000
 DOWNLOAD