Oilseeds and pulses production to witness a significant uptick in the current year
Agriculture has truly been one ‘bright spot’ in an otherwise challenging economic environment. Over the last three years, the average growth in the agricultural and the allied sector has stood at 4.1%. On the back of a good Rabi output, the prospects of a healthy kharif crop look strong at this stage given the timely onset of the monsoon in the Indian subcontinent and the favourable rainfall forecasts. This will help to moderate the inflationary expectations in the current year particularly in the food segment.
With Kerala receiving its first heavy showers in early June and the steady increase in precipitation along the western coast by early July, the South-West monsoon has been timely in the current year. IMD had already predicted a ‘normal’ monsoon for 2020 implying rainfall in the range of 96-104 per cent of the long period average (LPA). A month after the onset of monsoon, the rainfall across the country has actually been almost 17% above the LPA. It is encouraging to note that out of the 37 states and union territories, 30 have already received normal or above normal rainfall during the first month of the monsoon season.
Given the timely onset of the monsoon in all the major agricultural states in June-July 2020, the kharif crop outlook continues to be favourable. Expectedly, the progress of sowing across most kharif crops has been better than the previous years. The latest data indicates that the sown area for kharif has already covered almost 41% of the arable land as on July 3, 2020 as compared 23% in 2019 and 30% in 2018 at similar points in time. Unless there is an abrupt break in the progress of the monsoon or floods in the major agricultural zones, the sown area in the current year may break the previous records and lead to another bumper kharif harvest.
An analysis undertaken by Acuité Ratings on the crop wise sowing pattern clearly indicates that it is favourable towards the cash crops such as oilseeds and cotton.
The area sown under oilseeds has seen a very sharp jump from 3.4 million hectares in early July last year to 10.9 million hectares in the first week of July 2020, driven by a spurt in sowing of soya bean. It can be noted that the aggregate production of oilseeds in India has grown very slowly over the last 3 years FY 2017-20 at an average rate of 2.3%. The inflation rate of edible oils has been relatively high at 9% during FY20, leading to higher imports and also lately, there has been an upward revision in the minimum support price (MSP) for some oilseeds to an extent of 6%-13%. Indian farmers are also well aware of the development regarding India’s imposition of restrictions on import of palm oil from Malaysia, one of the primary sources. All of these factors have already led to increased preference for oilseed cultivation in the current season and an expectation of a good growth in oilseeds production in FY21.
Unlike oilseeds, the scenario is significantly different for cotton cultivation in FY21. Given the early rains in the cotton growing regions, the area sown under cotton has picked up quickly as compared to the previous year when sowing was significantly delayed due to late rains. However, cotton prices are likely to come under pressure in the current fiscal due to lower demand in the export market particularly from China which is the second largest buyer from India after Bangladesh. Indo-China trade dynamics has been significantly altered due to the conflict in Ladakh in the current year and may impact India’s cotton exports to China estimated to be around USD 200 million in FY20.
The area under sown for sugarcane has been largely stagnant as compared to the previous season given the continuing large inventory in the industry which will continue to constrain sugar prices.
Among the regular crops, the production of pulses may witness an uptick in the current year with the kharif sowing area sharply rebounding by almost four times as compared to last July. It may be noted that the inflation in pulses has been fairly sticky over the last few months.
Table 1: Progress in area under sown as on July 3, 2020:
|
|
Actual area (% of normal area) |
% change over previous year |
||||
|
|
2018 |
2019 |
2020 |
2018 |
2019 |
2020 |
|
Overall |
30.2 |
21.6 |
40.7 |
-16.9 |
-28.1 |
88.2 |
|
Food grain |
21.2 |
13.3 |
24.9 |
-19.5 |
-36.2 |
87.0 |
|
Cereals |
20.4 |
14.5 |
23.7 |
-15.5 |
-29.3 |
64.3 |
|
Rice |
17.4 |
12.4 |
17.2 |
-13.0 |
-28.4 |
38.3 |
|
Coarse cereals |
26.9 |
18.7 |
37.5 |
-18.6 |
-30.4 |
100.8 |
|
Pulses |
24.9 |
7.9 |
30.7 |
-33.0 |
-66.0 |
288.5 |
|
Sugar cane |
102.7 |
103.2 |
104.8 |
3.6 |
-3.0 |
1.5 |
|
Oilseeds |
32.2 |
18.5 |
60.0 |
-19.2 |
-43.3 |
224.5 |
|
Cotton |
45.6 |
37.9 |
75.8 |
-24.0 |
-16.0 |
99.9 |
Source:
CMIE, Acuité Research
Table 2: Minimum
support price in FY20 and FY21

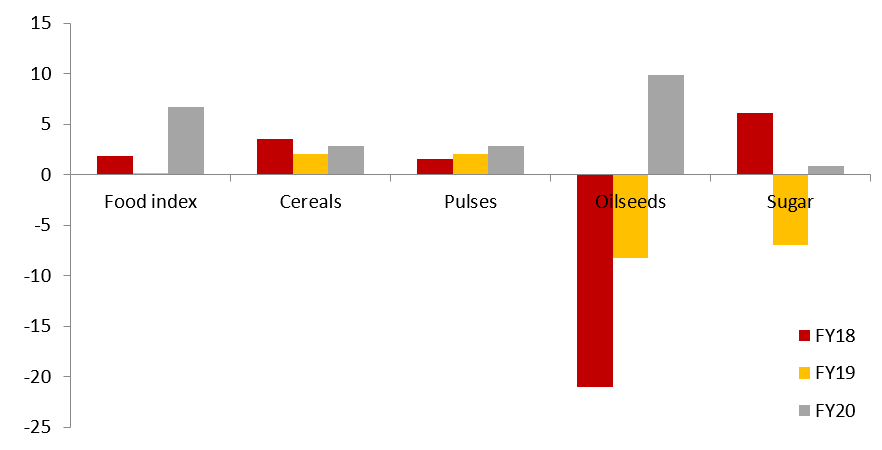
Table 3: Food Inflation
Table
4: Rainfall Status
|
Large Excess |
Excess |
Normal |
Deficient |
|
2 |
8 |
20 |
7 |
|
Sikkim |
Meghalaya |
Arunachal Pradesh |
Manipur |
|
Bihar |
Uttar Pradesh |
Assam |
Mizoram |
|
Madhya Pradesh |
Nagaland |
Himachal Pradesh |
|
|
Goa |
Tripura |
Jammu & Kashmir (UT) |
|
|
Chhattisgarh |
West Bengal |
Ladakh (UT) |
|
|
Andaman & Nicobar (UT) |
Jharkhand |
Dadra & Nagar Haveli (UT) |
|
|
Andhra Pradesh |
Uttarakhand |
Daman & Diu (UT) |
|
|
Telangana |
Haryana |
||
|
Chandigarh (UT) |
|||
|
Delhi (UT) |
|||
|
Punjab |
|||
|
Rajasthan |
|||
|
Odisha |
|||
|
Gujarat |
|||
|
Maharashtra |
|||
|
Tamil Nadu |
|||
|
Puducherry (UT) |
|||
|
Karnataka |
|||
|
Kerala |
|||
|
Lakshadweep (UT) |
 +91 99698 98000
 info@acuite.in
 Follow us
 +91 22 49294000
 DOWNLOAD