Indian economy continues to witness significantly lower trade deficit in the current fiscal with a sharp drop of 73.1% for the five month period April-August to USD 20.72 billion as compared to USD 77.25 billion in the previous year. While a steady pickup in exports took place in the April-July period, there has been a slight MoM decline in August to USD 22.7 billion as compared to USD 23.6 billion in the previous month. Given the overall decline in global demand, the 12.7% YoY decline in merchandise exports is not surprising and reflects the challenges that Indian exporters will continue to face in stepping up its shipment levels. On the other hand, the recovery in imports have also slowed down in August with a MoM growth of only 3.5%, reflecting the slower revival in industrial demand which largely follows from the prolonged impact of the pandemic. However, the 26.0% contraction in imports on a YoY basis is also linked to the significant drop in global crude prices in the last one year. The trade deficit marginally widened in August to USD 6.8 billion and could have actually been similar to the July levels had it not been for the sudden surge in gold imports to USD 3.7 billion by 171% YoY in August 2020.
One of the key aspects on the export front in the current year has been a precipitous decline in petroleum exports by 40% on YoY basis. We note that India’s export of petroleum products was just 60% of pre-Covid average and was pegged at only $1.9 billion by value in August. On an average, petroleum commodities contribute to 12% of total exports in the past 5 years; however, given the pandemic related demand shock as well as lower commodity prices, the category’s contribution to exports has come down substantially in FY21. Since May, the contribution of petroleum exports has come down to 8% on an average, diminishing the category’s value driven significance in India’s total exports.
Among non-oil exports, manufacturing exports have contracted by 8.8% YoY and the major product segment that has constrained the latter is gems and jewellery where the exports have dipped YoY by 43.3% respectively. The other sectors where export trajectory is weak includes textile yarn, readymade garments, leather and electronic goods. It is encouraging, however to note a sustained growth in exports of commodities and pharmaceutical goods. The exports of rice at USD 3.34 billion for the period April-August 2020 has witnessed a significant uptick with a 24.5% YoY. Iron ore exports have also picked primarily due to a strong revival in demand from China and along with higher prices, led to a YoY print of 53.7% in April - August. The shipments from the pharma sector have continued to be healthy at USD 9.56 billion for this 5 month period, clocking 13.0% YoY.
As regards imports, crude and petroleum product imports have expectedly seen a significant drop of 53.6% in the year upto August not only due to lower demand induced by the economic disruption but also on account of the sharply lower global crude prices that have dropped by 28% from around USD 60 a barrel (Aug 2019) to USD 43 a barrel (Aug 2020). What has also contributed to the lower import burden is the 57.5% lower volume of gold imports in the current financial year till August albeit there has been a surge in the previous month. Sharp rise in bullion prices to the extent of 30% in the last 6 months have depressed domestic demand apart from the pandemic related disruption while the late pickup can be attributed to the upcoming festive season. Substantially lower industrial demand has also led to lower imports of typically major categories such as coal, chemicals, steel, capital and electronic goods. The only category where there has been a positive growth in the last 5 months is pharmaceuticals with 1.27% YoY.
Given that the merchandise trade
deficit over April-August stood severely curtailed at USD 20.72 billion, the continuing
healthy surplus in the services sector (YSD 35 billion) has been able to offset
it more than adequately, translating to an overall trade surplus of USD 14.2
billion in FY21 YTD and thereby to a comfortable current account balance. In our opinion, the merchandise
trade deficit is unlikely to witness any significant increase over the next few
months and is likely to facilitate a current account surplus for the whole of FY21.
Table 1: FY21 YTD Monthly Trade Data
|
Month |
Export (% growth) |
Import (% growth) |
Trade Balance (USD Bn) |
||||
|
Overall |
Petroleum |
Mfg. |
Overall |
Crude oil |
Non- oil |
||
|
March, 2020 |
-34.66 |
-33.21 |
-34.84 |
-28.71 |
-14.87 |
-33.82 |
-9.79 |
|
April |
-60.55 |
-62.27 |
-60.28 |
-59.7 |
-59.81 |
-59.66 |
-6.81 |
|
May |
-35.74 |
-65.37 |
-29.88 |
-51.16 |
-72.07 |
-43.44 |
-3.62 |
|
June |
-12.45 |
-30.16 |
-10.36 |
-48.08 |
-55.81 |
-45.18 |
0.61 |
|
July |
-9.89 |
-49.31 |
-3.84 |
-29.57 |
-33.01 |
-28.48 |
-4.83 |
|
Aug-20 |
-12.65 |
-39.9 |
-8.82 |
-26.04 |
-41.62 |
-20.10 |
-6.77 |
Graph 1: FY21 YTD Monthly Trade Data
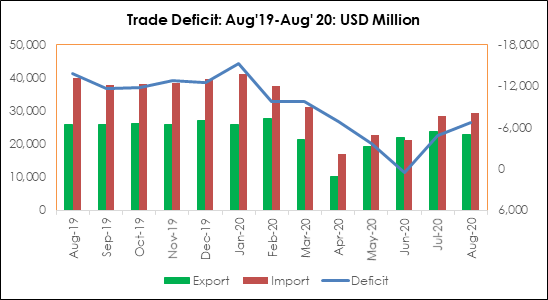
Source: Ministry of Commerce; CMIE
 +91 99698 98000
 info@acuite.in
 Follow us
 +91 22 49294000
 DOWNLOAD