Key Highlights:
Liquidity
The weighted average call money rate continues its five weeks long downward trend and reached 5.58% during the first week of August 2019. The daily average liquidity in the system stands at Rs. 1.14 lakh crore during the week. Taking advantage of surplus liquidity in the system, RBI has trimmed repo rate by 35 bps to 5.40% for reviving the domestic economy. Due to surfeit liquidity in the system, the call money rate got adjusted to the revised repo rate next day only. On a daily basis, the over-night lending rate has subsided to 5.31% as on August 14, 2019.
Capital Market
The 10-yr US sovereign yield has declined to 1.75% during the first week of August 2019. Following the similar trend, yield of 10-yr Indian G-sec has reached 6.50% during the same week. However, the Indian sovereign yield has reversed its trend and reached 5.62% this week. The bid-ask spread of 10-yr domestic sovereign bond has increased to 0.6 bps in July 2019 from 0.54 bps, the previous month. The higher spread is result of fall in demand for the Indian sovereign bond. Most of the emerging economies are facing weak demand as investors are moving their cash to safe assets. In addition, ECB is likely to issue fresh debt of €48 billion ($53bln) under assets purchasing programme (APP) during August and September, 2019. This will further impair the demand for sovereign bond of emerging economies.
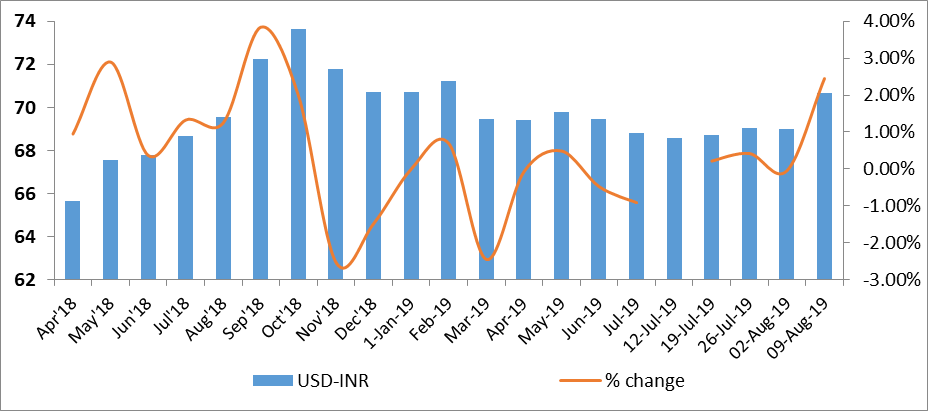
Currency Trend
Indian rupee has depreciated by 2.45% to 70.68 during the second week of Aug, 2019 on account of adverse global factors. The global currency market is highly volatile as emerging economies are reacting to the devaluation of CNY. In addition, the emerging market has been witnessing higher capital outflow as investors are concern about the global economic outlook. Moreover, the USD has been strengthening against the euro and British pound.
Interest rates and ratio:
|
Interest Rate |
Aug 3 |
July 5 |
July 12 |
July 19 |
July 26 |
Aug 2 |
|
2018 |
2019 |
2019 |
2019 |
2019 |
2019 |
|
|
Policy Repo Rate |
6.50 |
5.75 |
5.75 |
5.75 |
5.75 |
5.75 |
|
Call Money Rate (WA) |
6.24 |
5.67 |
5.62 |
5.61 |
5.59 |
5.58 |
|
364-Day Treasury Bill Yield |
7.27 |
6.13 |
6.06 |
5.98 |
5.98 |
5.94 |
|
2-Yr Indian G-Sec |
7.54 |
6.18 |
6.06 |
6.1 |
6.01 |
5.91 |
|
10-Yr Indian G-Sec |
7.73 |
6.76 |
6.56 |
6.45 |
6.62 |
6.50 |
|
10-Yr US G-Sec |
2.87 |
2.12 |
2.06 |
2.07 |
1.84 |
1.75 |
|
AAA (Indian corporate) |
8.78 |
8.04 |
8.3 |
7.42 |
7.76 |
7.50 |
|
Spread in bps (10Yr Indian-US) |
486 |
464 |
450 |
438 |
478 |
475 |
|
Credit/Deposit Ratio |
74.93 |
76.51 |
- |
76.34 |
- |
- |
|
USD LIBOR (3 month) |
1.9203 |
2.3564 |
2.359 |
2.3606 |
2.3504 |
2.1043 |
|
Forward Premia of US$ 1-month |
4.54 |
4.36 |
4.02 |
4.01 |
4.00 |
3.98 |
|
US$ 3-month |
4.54 |
4.60 |
4.19 |
4.15 |
4.09 |
4.09 |
|
US$ 6-month |
4.42 |
4.71 |
4.43 |
4.33 |
4.31 |
4.18 |
Acuité Portfolio Debt Instrument Benchmark
Estimates (as on Aug 12, 2019):
|
Category |
10-Yr Corporate Yield to Maturity |
|
AAA* |
NA |
|
AA+ |
7.66% |
|
AA |
8.63% |
|
|
Deposit (In Rs. Lakh cr) |
Bank Credit (In Rs. Lakh cr) |
|
As on July 19, 2019 |
126.49 |
96.57 |
|
As on June 21,2019 |
124.92 |
96.49 |
|
As on July 20,2018 |
114.37 |
86.09 |
|
YTD (% change) |
1.26% |
0.08% |
|
YoY (% change) |
10.60% |
12.17% |
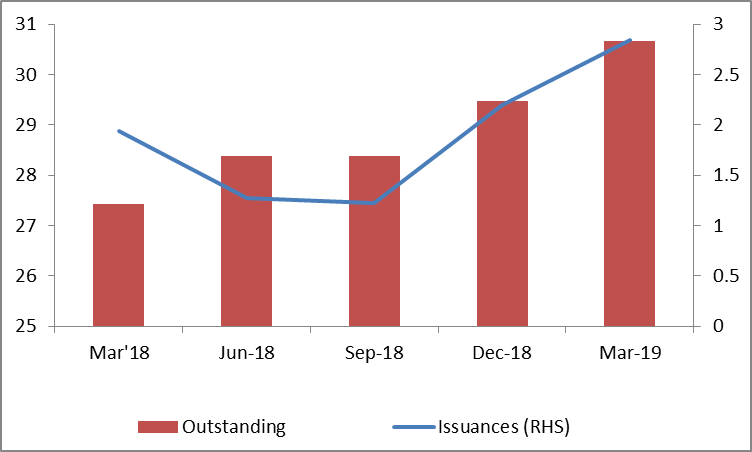
Money Market Performance
|
Commercial Paper (Fortnight): |
Outstanding (In Rs. Billion) |
Amount issued (In Rs. Billion) |
|
30-Jun-19 |
5,039.40 |
1076.9 |
|
15-Jun-19 |
5,561.80 |
1078.7 |
|
30-Jun-18 |
4,918.30 |
1267.3 |
|
% Change (MoM) |
-9.39% |
-0.17% |
|
% Change (YoY) |
2.46% |
-15.02% |
|
|
10 Aug 18 |
19 Jul 19 |
26 Jul 19 |
02 Aug 19 |
09 Aug 19 |
|
NSE Index |
11,429.50 |
11,419.25 |
11,284.30 |
10,997.35 |
11,109.65 |
|
NSE Index Return |
0.60 |
-1.15 |
-1.18 |
-2.54 |
1.02 |
|
BSE Index |
37,869.23 |
38,337.01 |
37,882.79 |
37,118.22 |
37,581.91 |
|
BSE Index Return |
0.83 |
-1.03 |
-1.18 |
-2.02 |
1.25 |
Liquidity Operation by RBI
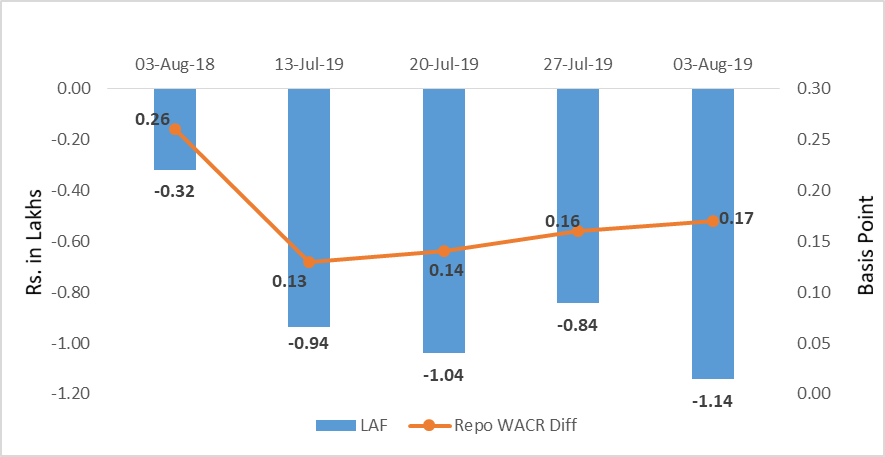
Source: RBI, Acuité Research; Note: Net injection (+) and Net absorption (-)
Corporate debt (in Rs. Lakh Cr)
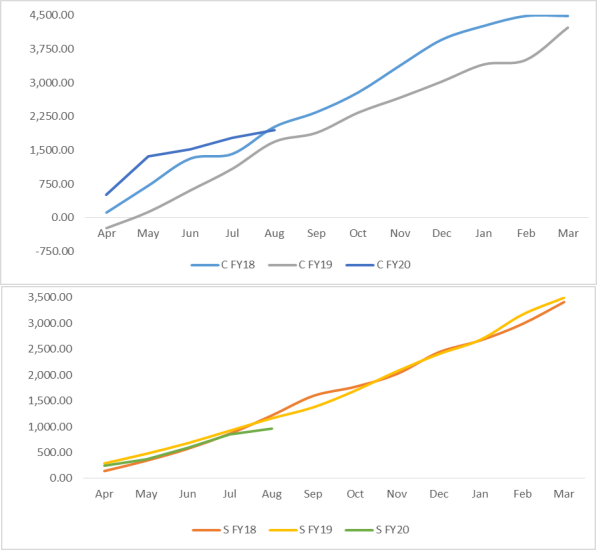
Net Debt Issuance by Centre and State Government (Rs. Billion)
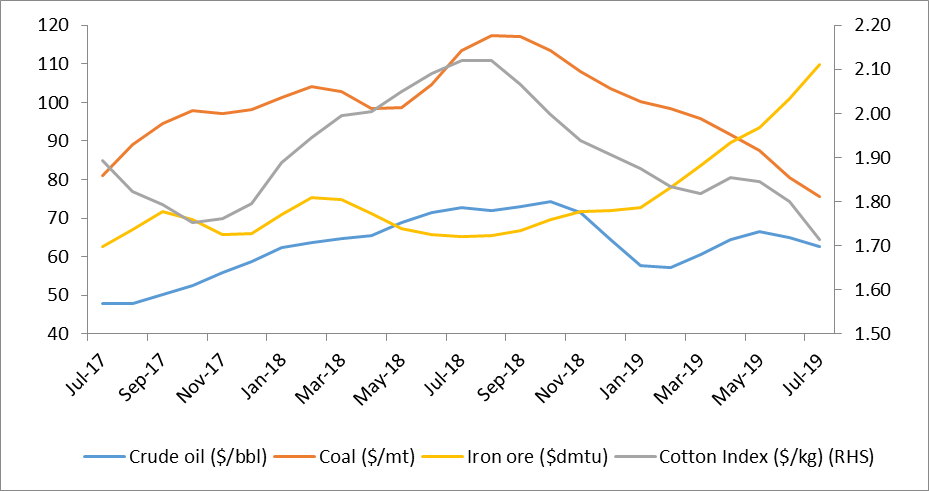
Commodity Price Index (3 Month Moving Average)
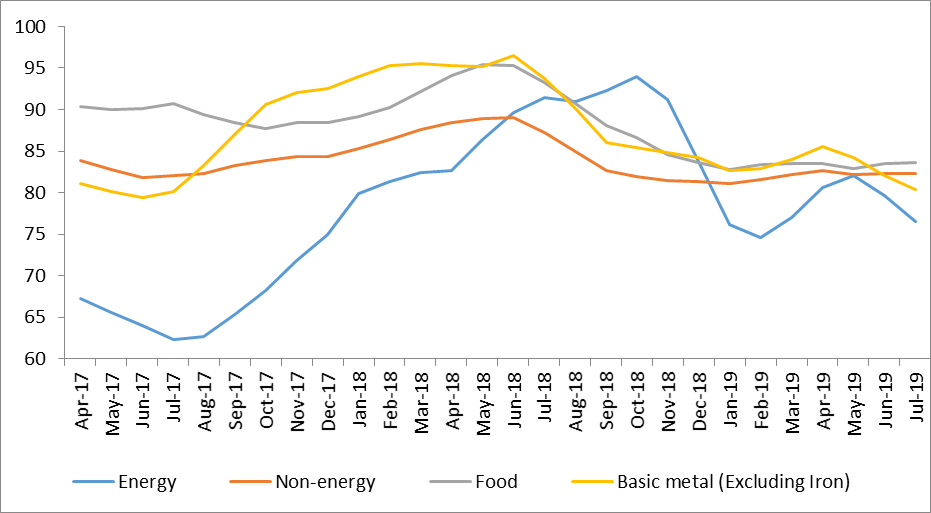
Commodity Price Movement (3 Month Moving Average)
USD-INR Movement
Source: RBI, Acuité Research
 +91 99698 98000
 info@acuite.in
 Follow us
 +91 22 49294000
 DOWNLOAD