Key Highlights:
Liquidity
The call money rate stands at 5.32% during the third week of August 2019, which is eight bps lower than the repo rate. The over-night lending rate quickly adjusted to the revised repo rate due to surplus liquidity. During this week, banking sector has surplus liquidity of Rs. 1.07 lakh crore. This was around Rs. 11,000 crore during the same week the previous year. The excess liquidity during the current financial year is due to mild credit offtake.
Capital Market
In the global capital market, the negative yielding bond are continue to witness higher demand. The investors prefer the negative yielding bond because of two reasons. First, they want to hedge by expecting the USD to weaken (expecting a rate cut cycle) against the euro in future. Second, due to slowing global economic outlook, demand for the safe heaven assets to increase further. Therefore, price of these bonds is expected to increase further. Therefore, they can still make profit despite a negative yield. In the domestic market, being concerned about domestic growth outlook and fiscal target, investors are pulling out their money from the equity and debt market.
Currency Trend
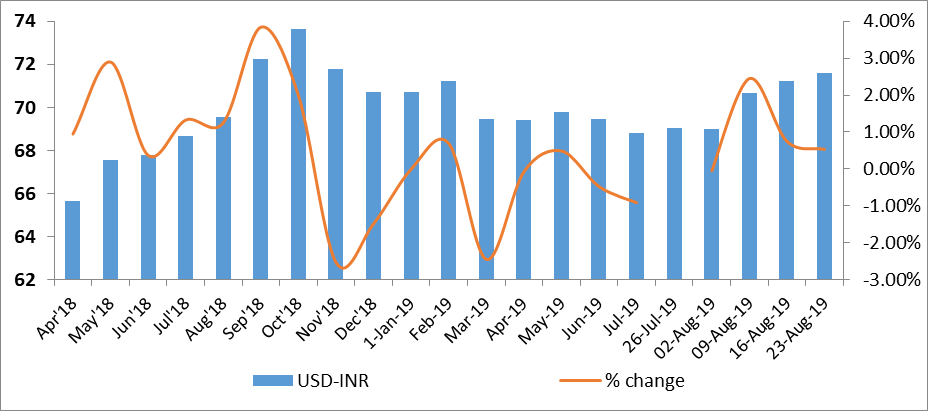
Indian rupee has been reeling under higher capital outflows and currency war. The Indian rupee has reached nine month high of 71.59 against the USD during the fourth week of August. However, a fall in one and three month forward premia of USD hints the Indian rupee to rebound in a short to medium term.
Interest rates and ratio:
|
Interest Rate |
Aug 17 |
July 19 |
July 26 |
Aug 2 |
Aug 9 |
Aug 16 |
|
2018 |
2019 |
2019 |
2019 |
2019 |
2019 |
|
|
Policy Repo Rate |
6.5 |
5.75 |
5.75 |
5.75 |
5.4 |
5.4 |
|
Call Money Rate (WA) |
6.39 |
5.61 |
5.59 |
5.58 |
5.45 |
5.32 |
|
364-Day Treasury Bill Yield |
7.3 |
5.98 |
5.98 |
5.94 |
5.85 |
5.77 |
|
2-Yr Indian G-Sec |
7.64 |
6.1 |
6.01 |
5.91 |
5.90 |
5.90 |
|
10-Yr Indian G-Sec |
7.85 |
6.45 |
6.62 |
6.5 |
6.64 |
6.69 |
|
10-Yr US G-Sec |
2.81 |
2.07 |
1.84 |
1.75 |
1.56 |
1.53 |
|
AAA (Indian corporate) |
8.3352 |
7.42 |
7.76 |
7.5 |
6.96 |
7.61 |
|
Spread in bps (10Yr Indian- US) |
504 |
438 |
478 |
475 |
508 |
516 |
|
Credit/Deposit Ratio |
75.35 |
76.35 |
- |
76.34 |
- |
- |
|
USD LIBOR (3 month) |
1.9151 |
2.3606 |
2.3504 |
2.1043 |
2.0953 |
2.0959 |
|
Forward Premia of US$ 1-month |
4.44 |
4.01 |
4.00 |
3.98 |
3.74 |
3.70 |
|
US$ 3-month |
4.56 |
4.15 |
4.09 |
4.09 |
3.86 |
3.90 |
|
US$ 6-month |
4.27 |
4.33 |
4.31 |
4.18 |
3.94 |
3.96 |
Acuité Portfolio Debt Instrument Benchmark
Estimates (as on Aug 27, 2019):
|
Category |
10-Yr Corporate Yield to Maturity |
|
AAA* |
NA |
|
AA+ |
8.07% |
|
AA |
8.51% |
|
|
Deposit (In Rs. Lakh Cr) |
Bank Credit (In Rs. Lakh Cr) |
|
As on Aug 02,2019 |
127.45 |
97.3 |
|
As on July 05,2019 |
126.75 |
96.97 |
|
As on Aug 03,2018 |
124.32 |
86.73 |
|
YTD (% change) |
0.55% |
0.34% |
|
YoY (% change) |
2.52% |
12.19% |
|
Commercial Paper (Fortnight) |
Outstanding (In Rs. Billion) |
Amount issued (In Rs. Billion) |
|
30-Jun-19 |
5,039.40 |
1076.9 |
|
15-Jun-19 |
5,561.80 |
1078.7 |
|
30-Jun-18 |
4,918.30 |
1267.3 |
|
% Change (MoM) |
-9.39% |
-0.17% |
|
% Change (YoY) |
2.46% |
-15.02% |
|
|
24-Aug-18 |
02-Aug-19 |
09-Aug-19 |
16-Aug-19 |
23-Aug-19 |
|
NSE Index |
11,557.10 |
10,997.35 |
11,109.65 |
11,047.80 |
10,829.35 |
|
NSE Index Return |
0.75 |
-2.54 |
1.02 |
-0.56 |
-1.98 |
|
BSE Index |
38,251.80 |
37,118.22 |
37,581.91 |
37,350.33 |
36,701.16 |
|
BSE Index Return |
0.8 |
-2.02 |
1.25 |
-0.62 |
-1.74 |
Liquidity Operation by RBI
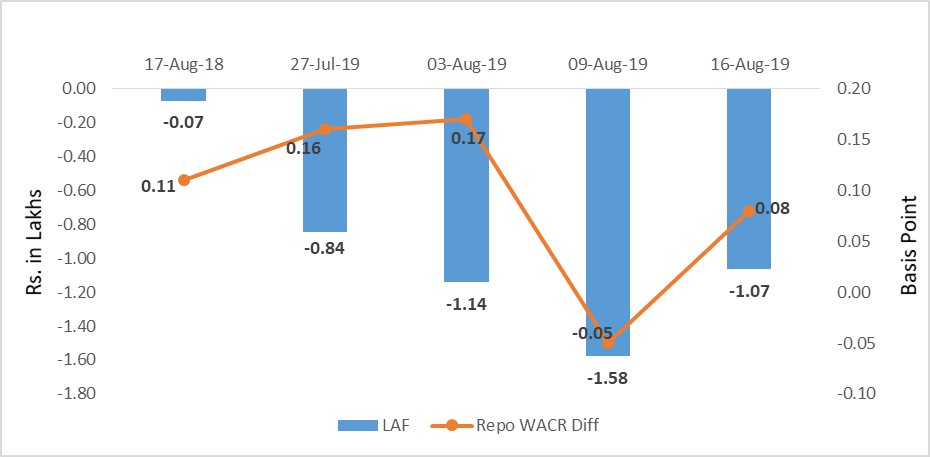
Source: RBI, Acuité Research; Note: Net injection (+) and Net absorption (-)
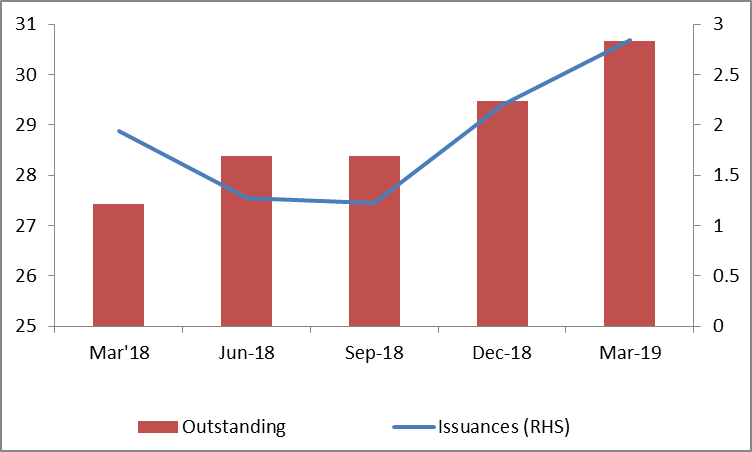
Corporate debt (in Rs. Lakh Cr)
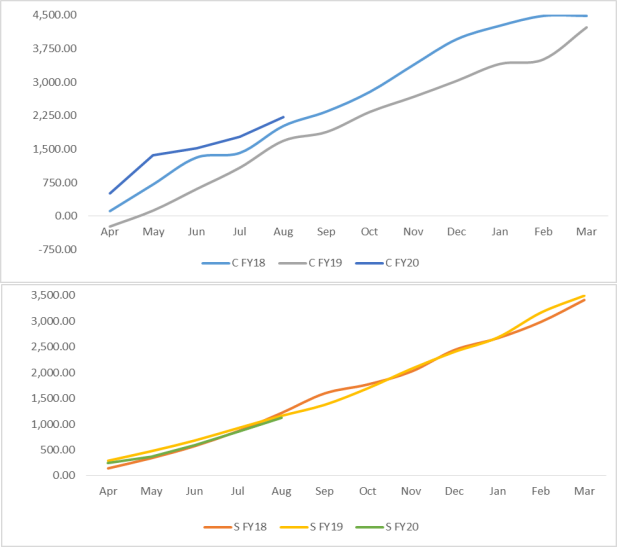
Net Debt Issuance by Centre and State Government (Rs. Billion)
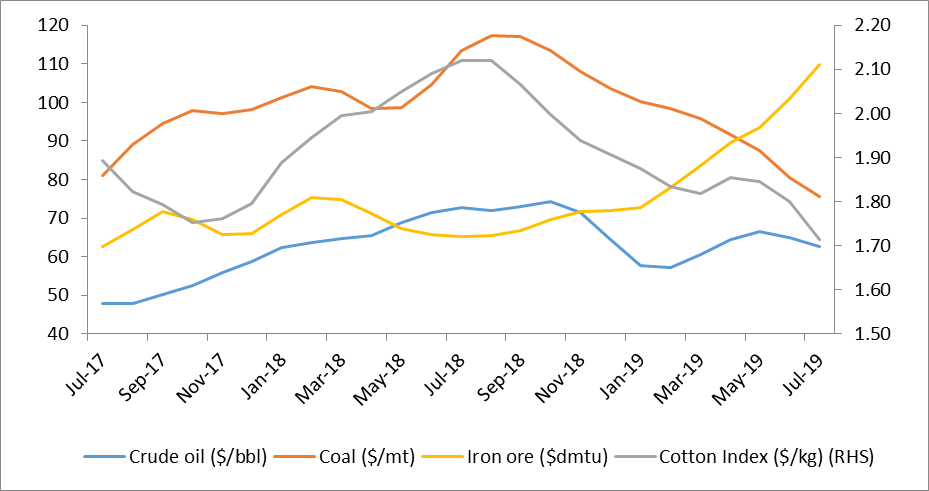
Commodity Price Index (3 Month Moving Average)
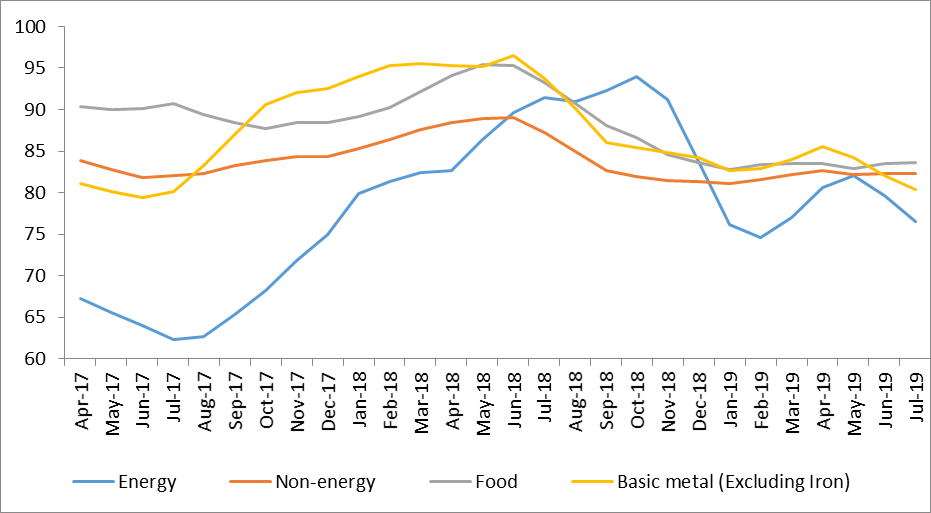
Commodity Price Movement (3 Month Moving Average)
USD-INR Movement
Source: RBI, Acuité Research
 +91 99698 98000
 info@acuite.in
 Follow us
 +91 22 49294000
 DOWNLOAD