Key Highlights:
Liquidity
The spread between over-night lending rate and repo rate has further increased to nine bps during the 4th week of September 2019. The surplus liquidity in the banking system stands at Rs. 1.35 lakh crore. Liquidity is mounting in the system as credit offtake has been impaired. The incremental Credit-Deposit ratio continues to be negative since July 2019. This financial year (until August), RBI has trimmed policy rate by 85 bps however weighted average lending rate on fresh lending has moderated by just 8 bps. Ironically, the lending rate on outstanding loan has gone up by 10 bps during the same time frame.
Capital Market
On the global capital market front, the 10-year US sovereign yields are on a downward roll for past three weeks. It is known that the FOMC has cut the fed fund rate by 25 bps in September. In the domestic market, 10-year Indian sovereign bond is yielding 6.85%. Consequently, the spread between 10-year Indian and US sovereign bond reached 532 bps, which was around 480 bps a few months ago. The higher spread is on account of higher government borrowings.
Currency Trend
In the global currency market, the emerging market currencies are strengthening against the US dollar. With the Fed’s accommodative monetary policy, yield chasing capital inflows to emerging market have been increasing. Therefore, Indian rupee has also been appreciating against the USD for the past three weeks and reached 70.9 during the first week of October 2019. The forward premia for 1-month has improved by 42bps is a result of fall in interest rate differential and increase in FII inflows.
Interest rates and ratio:
|
Interest Rate |
Sep 28 |
Aug 30 |
Sep 06 |
Sep 13 |
Sep 20 |
Sep 27 |
|
2018 |
2019 |
2019 |
2019 |
2019 |
2019 |
|
|
Policy Repo Rate |
6.50 |
5.40 |
5.40 |
5.40 |
5.40 |
5.40 |
|
Call Money Rate (WA) |
6.49 |
5.36 |
5.34 |
5.31 |
5.36 |
5.31 |
|
364-Day Treasury Bill Yield |
7.73 |
5.72 |
5.69 |
5.65 |
5.60 |
5.60 |
|
2-Yr Indian G-Sec |
7.80 |
5.78 |
5.77 |
5.73 |
5.91 |
5.78 |
|
10-Yr Indian G-Sec |
8.00 |
6.70 |
6.73 |
6.77 |
6.91 |
6.85 |
|
10-Yr US G-Sec |
3.23 |
1.56 |
1.90 |
1.72 |
1.69 |
1.53 |
|
AAA (Indian corporate) |
9.07 |
7.70 |
8.01 |
7.85 |
7.70 |
7.84 |
|
Spread in bps (10Yr Indian- US) |
476.7 |
514 |
483 |
505 |
522.3 |
532 |
|
Credit/Deposit Ratio |
76.12 |
75.74 |
- |
76.25 |
- |
- |
|
USD LIBOR (3 month) |
2.1739 |
2.0866 |
2.0976 |
2.0883 |
2.1549 |
1.8299 |
|
Forward Premia of US$ 1-month |
4.96 |
3.85 |
4.18 |
4.57 |
4.40 |
3.98 |
|
US$ 3-month |
4.58 |
4.18 |
4.24 |
4.43 |
4.17 |
3.95 |
|
US$ 6-month |
4.36 |
4.24 |
4.28 |
4.48 |
4.38 |
4.23 |
Source: RBI, Investing.com
Acuité Portfolio Debt Instrument Benchmark
Estimates (as on Oct, 10 2019):
|
Category |
10-Yr Corporate Yield to Maturity |
|
AAA* |
NA |
|
AA+ |
8.17% |
|
AA |
8.63% |
Source: Acuité Research; # Discount Factor: 0.0508; *Outside Benchmark
|
|
Deposit (In Rs. Lakh cr) |
Bank Credit (In Rs. Lakh cr) |
|
As on Sep 13,2019 |
127.23 |
97.01 |
|
As on Aug 16,2019 |
126.80 |
96.83 |
|
As on Sep 14,2018 |
115.6 |
87.98 |
|
YTD (% change) |
0.34% |
0.19% |
|
YoY (% change) |
10.0% |
10.26% |
Source:
RBI
Money Market Performance
|
Commercial Paper (Fortnight): |
Outstanding (In Rs. Billion) |
Amount issued (In Rs. Billion) |
|
30-Jun-19 |
5,039.40 |
1076.9 |
|
15-Jun-19 |
5,561.80 |
1078.7 |
|
30-Jun-18 |
4,918.30 |
1267.3 |
|
% Change (MoM) |
-9.39% |
-0.17% |
|
% Change (YoY) |
2.46% |
-15.02% |
Source: RBI
Indices
|
|
28-Sep-18
|
06-Sep-19
|
13-Sep-19
|
20-Sep-19
|
27-Sep-19
|
|
NSE Index
|
10,930.45
|
10,946.20
|
11,075.90
|
11,274.20
|
11,512.40
|
|
NSE Index Return
|
-1.91
|
-0.7
|
1.18
|
1.79
|
2.11
|
|
BSE Index
|
36,227.14
|
36,981.77
|
37,384.99
|
38,014.62
|
38,822.57
|
|
BSE Index Return
|
-1.67
|
-0.94
|
1.09
|
1.68
|
2.13
|
Liquidity Operation by RBI:
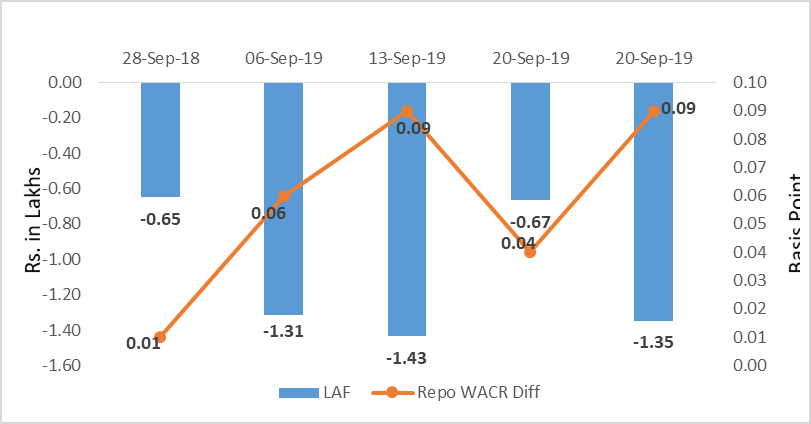
Source: RBI, Acuité Research;
Note: Net injection (+) and Net absorption (-)
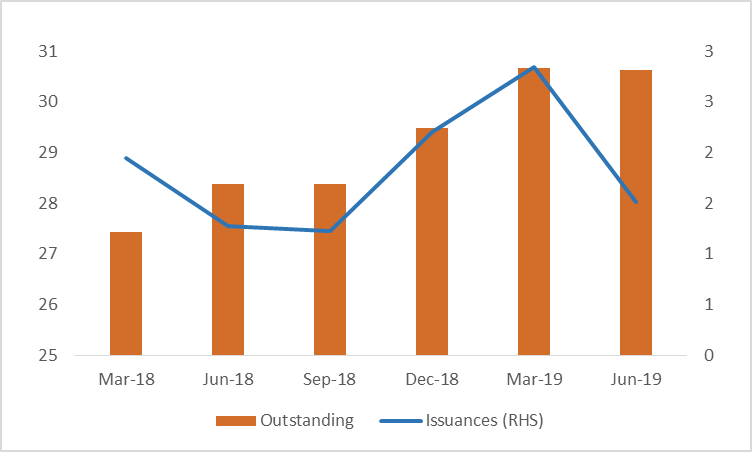
Corporate debt (in Rs. Lakh Cr):
Net Debt Issuance by Centre and State Government (Rs. Billion):
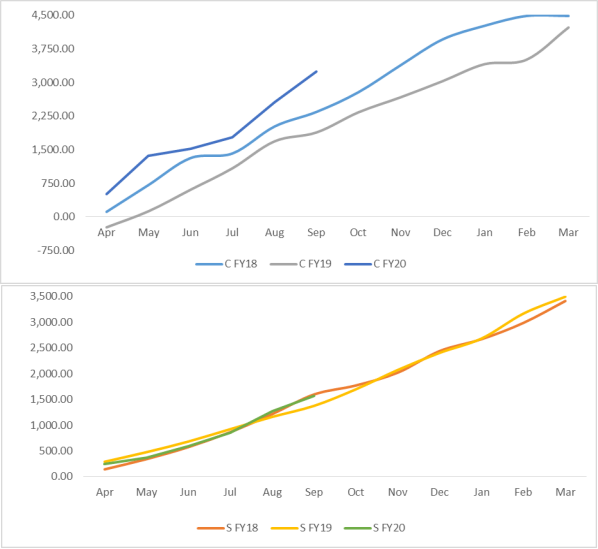
Source: Acuité Research, RBI
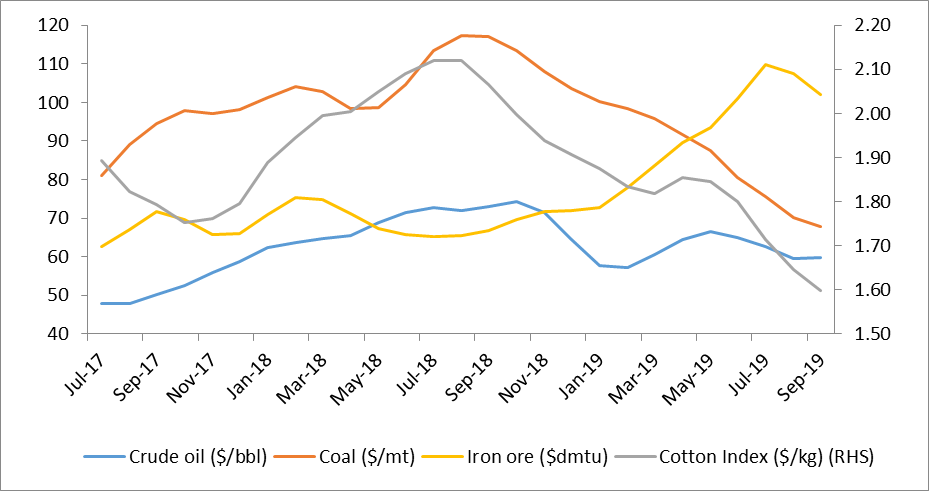
Commodity Price Index (3 Month Moving Average):
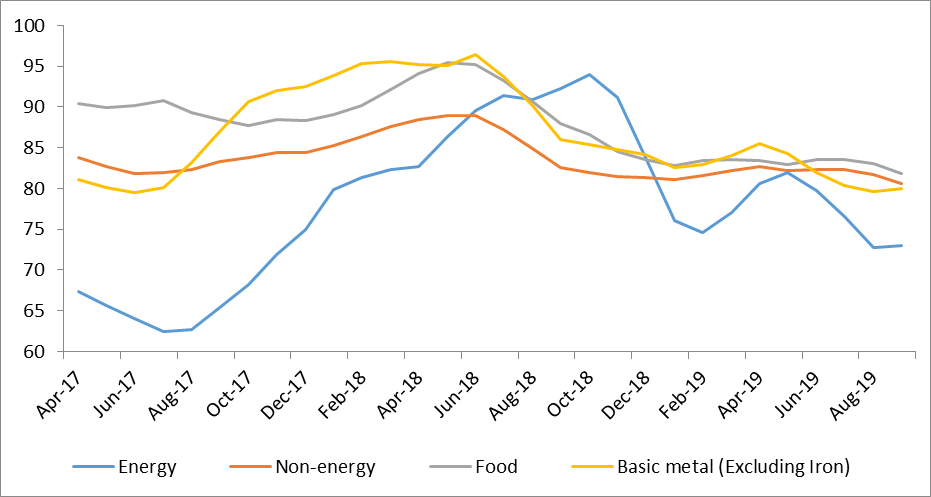
Commodity Price Movement (3 Month Moving Average):
USD-INR Movement:
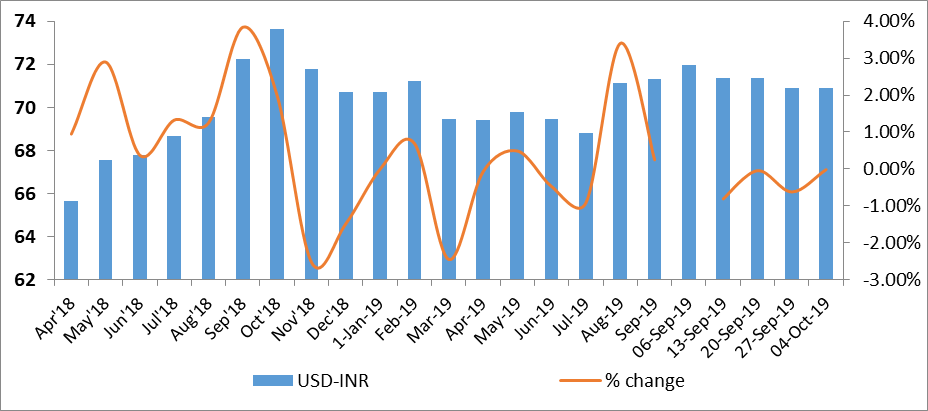
Source: RBI, Acuité Research
Birabrata Panda
Sr. Statistician/Economist
 +91 99698 98000
 info@acuite.in
 Follow us
 +91 22 49294000
 DOWNLOAD