Key Highlights:
Liquidity
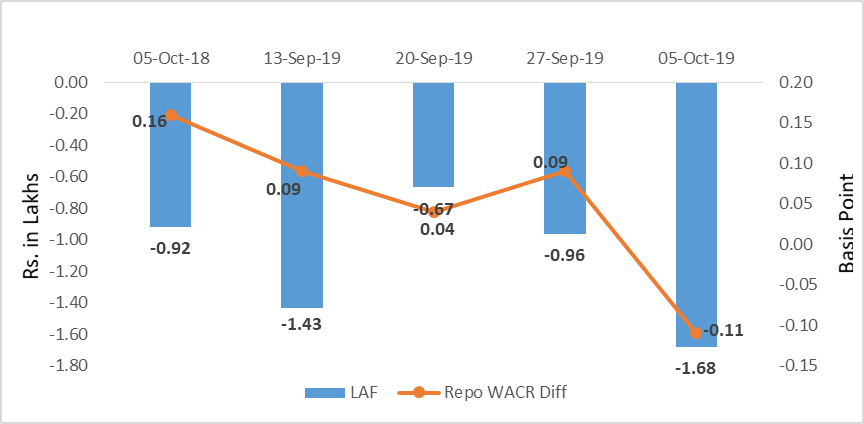
The weighted average call money rate further subsided to 5.26% during the first week of October, 2019 adjusting to the revised policy rate. During this week, the MPC committee has trimmed the repo rate by 25 bps to 5.15%. Excess liquidity in the system has further increased to Rs. 1.68 lakh crore as credit offtake has reduced to 8.8% due to a hostile base. However, as the festive season commences, last two fortnights have witnessed a positive trend in incremental credit offtake.Capital Market
On the global capital market front, the 10-year US sovereign yield has surged by 20 bps to 1.73% over the week. This might be happening because of two reasons. First, investors are optimistic regarding the US-China trade negotiations and switching from capital market to equity market. Second, a reinvigorated Chinese economy may drive up commodity prices, leading to inflationary expectations. On the domestic market front, the 10-year sovereign yield has reduced by 36 bps to 6.47% in reaction to the revised policy rate. The bid-ask spread sovereign bond has also reduced to 0.66 bps in September 2019 from 0.71 bps in August 2019 – indicating an improvement in demand for the sovereign bonds.Currency Trend
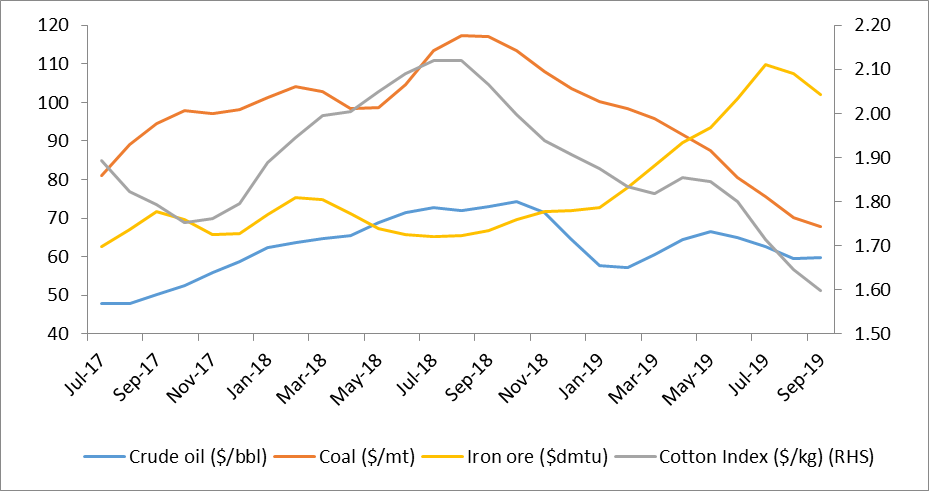
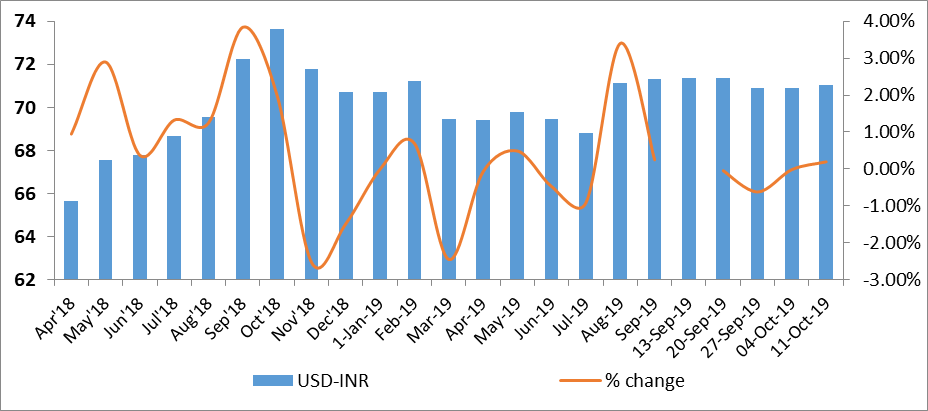
The currency market has been stabilizing after a currency war during August 2019. USD-INR currency pair has been hovering at 70.9 for past three weeks. As commodity prices are continuing to remain weak, domestic currency is expected to strengthen with lower trade deficit. The down-ward trend in over-night LIBOR rate indicates that global liquidity has been increasing. This gives a sense of stronger emerging markets currencies against the USD.
Interest rates and ratio:
|
Interest Rate |
Oct 05 |
Sep 06 |
Sep 13 |
Sep 20 |
Sep 27 |
Oct 04 |
|
2018 |
2019 |
2019 |
2019 |
2019 |
2019 |
|
|
Policy Repo Rate |
6.50 |
5.40 |
5.40 |
5.40 |
5.40 |
5.15 |
|
Call Money Rate (WA) |
6.34 |
5.34 |
5.31 |
5.36 |
5.31 |
5.26 |
|
364-Day Treasury Bill Yield |
7.77 |
5.69 |
5.65 |
5.60 |
5.60 |
5.53 |
|
2-Yr Indian G-Sec |
7.69 |
5.77 |
5.73 |
5.91 |
5.78 |
5.75 |
|
10-Yr Indian G-Sec |
8.02 |
6.73 |
6.77 |
6.91 |
6.85 |
6.47 |
|
10-Yr US G-Sec |
3.17 |
1.90 |
1.72 |
1.69 |
1.53 |
1.73 |
|
AAA (Indian corporate) |
8.84 |
8.01 |
7.85 |
7.70 |
7.84 |
7.54 |
|
Spread in bps (10Yr Indian- US) |
485 |
483 |
505 |
522.3 |
532.1 |
474 |
|
Credit/Deposit Ratio |
76.12 |
- |
76.33 |
- |
75.71 |
- |
|
USD LIBOR (Over-night) |
2.1652 |
2.0976 |
2.0883 |
2.1549 |
1.8299 |
1.8224 |
|
Forward Premia of US$ 1-month |
4.73 |
4.18 |
4.57 |
4.40 |
3.98 |
4.40 |
|
US$ 3-month |
4.59 |
4.24 |
4.43 |
4.17 |
3.95 |
3.87 |
|
US$ 6-month |
4.40 |
4.28 |
4.48 |
4.38 |
4.23 |
4.18 |
|
|
Deposit (In Rs. Lakh cr) |
Bank Credit (In Rs. Lakh cr) |
|
As on Sep 27,2019 |
129.07 |
97.11 |
|
As on Aug 30,2019 |
127.80 |
86.81 |
|
As on Sep 28,2018 |
118.00 |
89.82 |
|
MoM (% change) |
0.99% |
0.8% |
|
YoY (% change) |
9.38% |
8.79% |
Money
Market Performance
|
Commercial Paper (Fortnight): |
Outstanding (In Rs. Billion) |
Amount issued (In Rs. Billion) |
|
30-Jun-19 |
5,039.40 |
1076.9 |
|
15-Jun-19 |
5,561.80 |
1078.7 |
|
30-Jun-18 |
4,918.30 |
1267.3 |
|
% Change (MoM) |
-9.39% |
-0.17% |
|
% Change (YoY) |
2.46% |
-15.02% |
Indices
|
|
05-Oct-18 |
13-Sep-19 |
20-Sep-19 |
27-Sep-19 |
04-Oct-19 |
|
NSE Index |
10,316.45 |
11,075.90 |
11,274.20 |
11,512.40 |
11,174.75 |
|
NSE Index Return |
-5.62 |
1.18 |
1.79 |
2.11 |
-2.93 |
|
BSE Index |
34,376.99 |
37,384.99 |
38,014.62 |
38,822.57 |
37,673.31 |
|
BSE Index Return |
-5.11 |
1.09 |
1.68 |
2.13 |
-2.96 |
Source: RBI, Acuité Research;
Note: Net injection (+) and Net absorption (-)
Source: RBI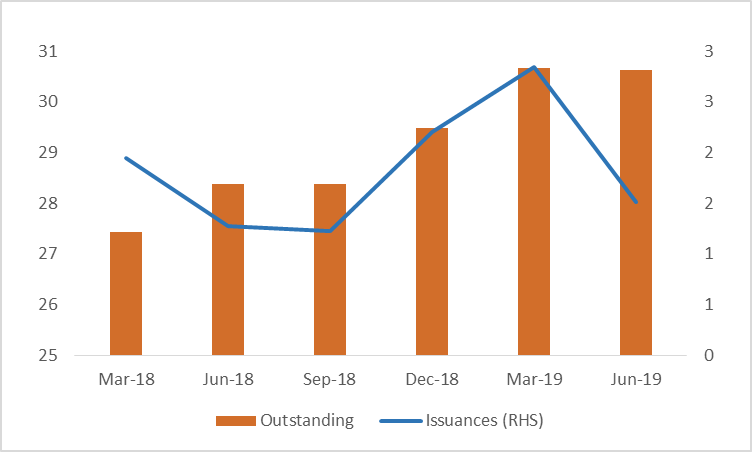
Birabrata Panda
Sr. Statistician/Economist
 +91 99698 98000
 info@acuite.in
 Follow us
 +91 22 49294000
 DOWNLOAD