Key Highlights:
Liquidity
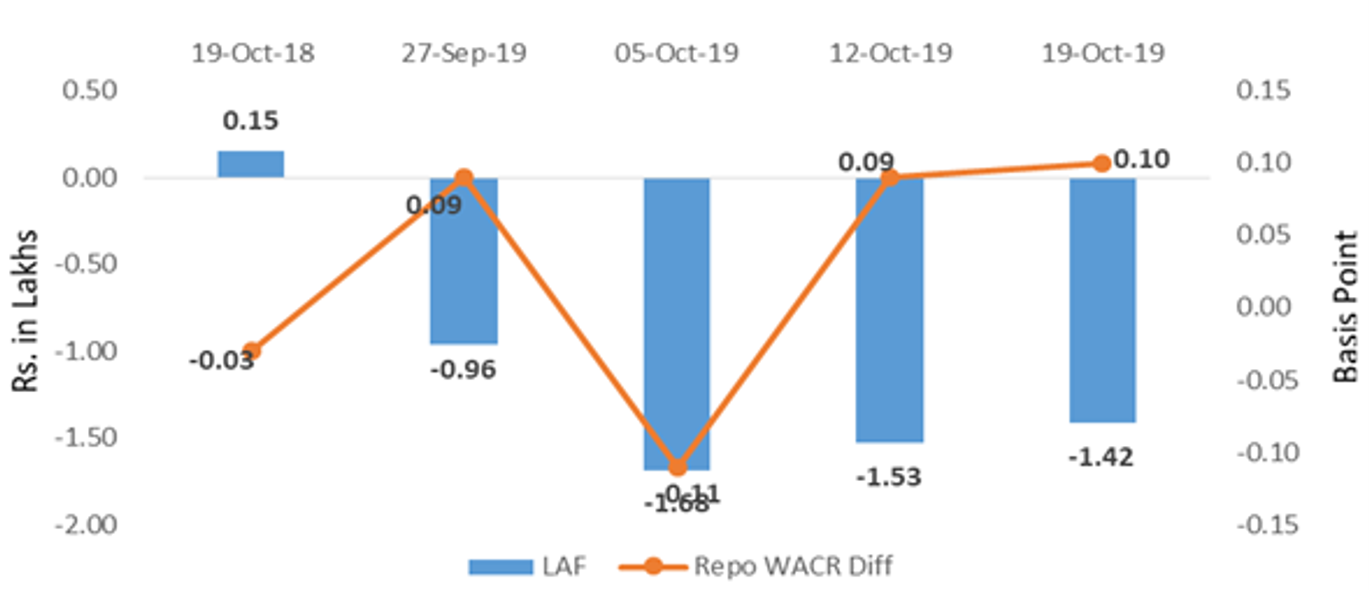
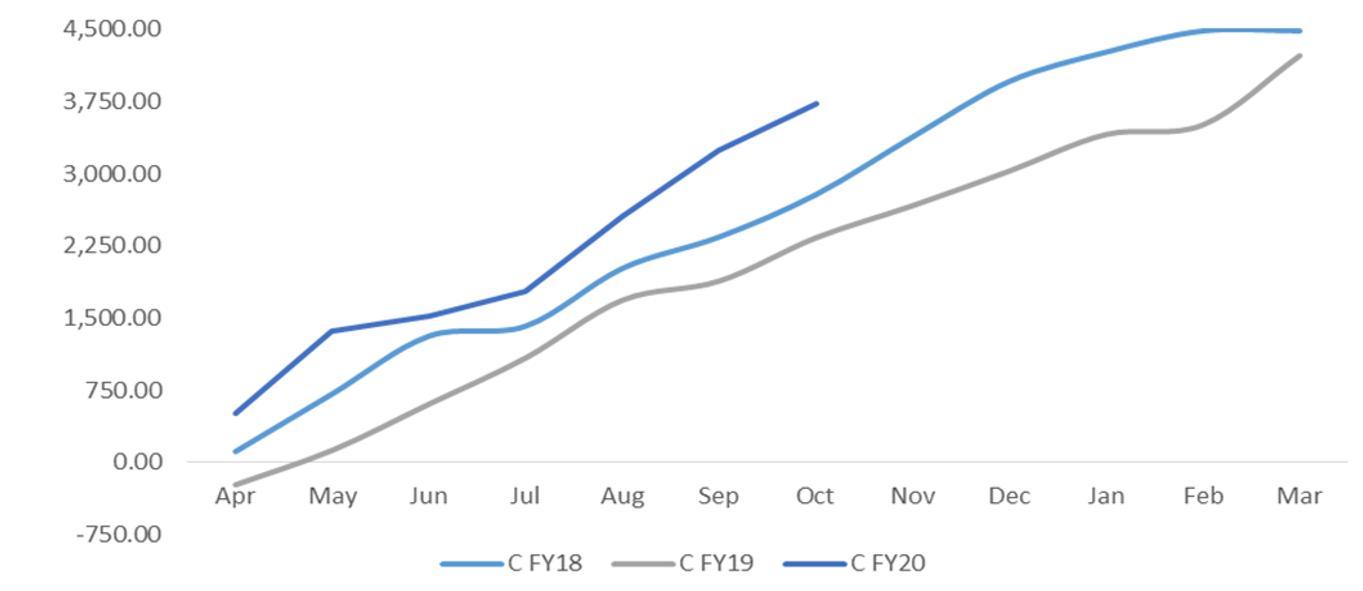
The spread between repo and call money rate (WACR) further declined to 10bps over a week during third week of October. However, surplus liquidity in the system has subsided to Rs.1.43 lakh crore during the same time. The surplus liquidity had reached a record level of average 1.68 lakh crore during the first week of October 2019. In a positive development, the incremental credit deposit ratio turned positive for first time in FY20 during first fortnight of October. This hints a recovery in the credit cycle. It is known that due to weak demand, the incremental credit offtake in FY20 (YTD) is a tepid Rs.0.16 lakh crore, a number which was Rs.3.67 lakh crore during the same time the previous year. During the anomalous bout of offtake, investment in government and other approved securities stands at Rs.3.22 lakh crore in FY20. The investment was Rs.1.76 lakh crore a year earlier.
Capital Market
On the global capital market front, there is a sharp increase in 10-yr US sovereign yield as fed’s meeting and Q3 GDP data are due in this week. Yields in the Euro zone have been recovering from the fall in August as ECB is resuming assets buying program from October 30, 2019. This will further increase the global liquidity and hence EMs can expect higher capital inflows. On the domestic market, the 10-year Indian sovereign yield has subsided by 11bps to 7.61% over a week during the reference week. The spread between 10-yr Indian and US sovereign yield which was above 500bps for past two months has reduced to the 477 bps, consequently. The lower spread indicates that the risk appetite of investors is increasing.
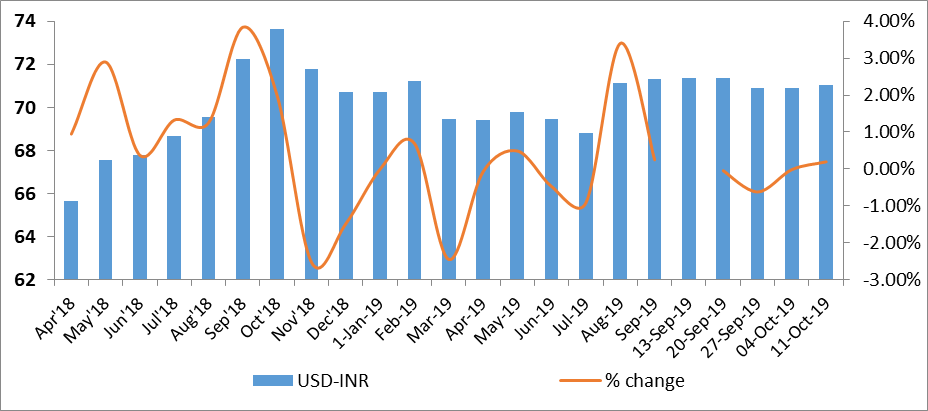
Currency Trend
On the currency market, volatility in USD-INR has come down to 0.37% in October, from 0.92% in August. As the exchange rate adjusts to the revised interest rate, the currency market has been stabilizing. However, the currency market may again be volatile if the fed further change the fed rate and its stance, a decision that is due this week.
Interest rates and ratio:
|
Interest Rate |
Oct 19 |
Sep 20 |
Sep 27 |
Oct 04 |
Oct 11 |
Oct 18 |
|
2018 |
2019 |
2019 |
2019 |
2019 |
2019 |
|
|
Policy Repo Rate |
6.50 |
5.40 |
5.40 |
5.15 |
5.15 |
5.15 |
|
Call Money Rate (WA) |
6.53 |
5.36 |
5.31 |
5.26 |
5.06 |
5.05 |
|
364-Day Treasury Bill Yield |
7.50 |
5.60 |
5.60 |
5.53 |
5.41 |
5.37 |
|
2-Yr Indian G-Sec |
7.59 |
5.91 |
5.78 |
5.75 |
5.67 |
5.64 |
|
10-Yr Indian G-Sec |
7.88 |
6.91 |
6.85 |
6.47 |
6.54 |
6.57 |
|
10-Yr US G-Sec |
3.08 |
1.69 |
1.53 |
1.73 |
1.75 |
1.80 |
|
AAA (Indian corporate) |
8.84 |
7.70 |
7.84 |
7.54 |
7.72 |
7.61 |
|
Spread in bps (10Yr Indian- US) |
480 |
522 |
532 |
474 |
479 |
477 |
|
Credit/Deposit Ratio |
76.3 |
- |
75.67 |
- |
75.66 |
- |
|
USD LIBOR (3 month) |
2.1703 |
2.1549 |
1.8299 |
1.8224 |
1.7926 |
1.8381 |
|
Forward Premia of US$ 1-month |
5.23 |
4.40 |
3.98 |
4.40 |
3.72 |
3.79 |
|
US$ 3-month |
4.49 |
4.17 |
3.95 |
3.87 |
3.80 |
3.71 |
|
US$ 6-month |
4.36 |
4.38 |
4.23 |
4.18 |
4.08 |
4.05 |
|
|
Deposit (In Rs. Lakh cr) |
Bank Credit (In Rs. Lakh cr) |
|
As on Oct 11,2019 |
129.38 |
97.88 |
|
As on Sep 13,2019 |
127.23 |
97.12 |
|
As on Oct 12,2018 |
117.86 |
89.93 |
|
YTD (% change) |
1.69% |
0.79% |
|
YoY (% change) |
9.77% |
8.84% |
Money Market Performance
|
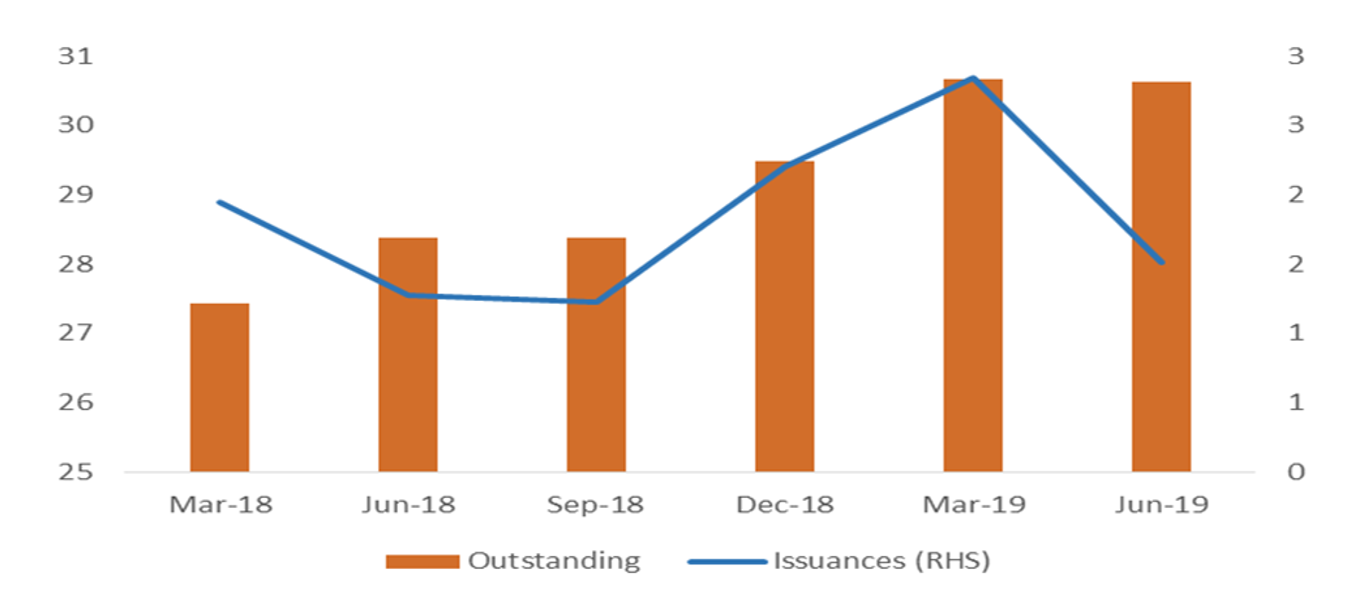
Commercial Paper (Fortnight): |
Outstanding (In Rs. Billion) |
Amount issued (In Rs. Billion) |
|
30-Jun-19 |
5,039.40 |
1076.9 |
|
15-Jun-19 |
5,561.80 |
1078.7 |
|
30-Jun-18 |
4,918.30 |
1267.3 |
|
% Change (MoM) |
-9.39% |
-0.17% |
|
% Change (YoY) |
2.46% |
-15.02% |
Indices
|
|
19-Oct-18 |
27-Sep-19 |
04-Oct-19 |
11-Oct-19 |
18-Oct-19 |
|
NSE Index |
10,030.00 |
11,512.40 |
11,174.75 |
11,305.05 |
11,661.85 |
|
NSE Index Return |
-2.65 |
2.11 |
-2.93 |
1.17 |
3.16 |
|
BSE Index |
34,315.63 |
38,822.57 |
37,673.31 |
38,127.08 |
39,298.38 |
|
BSE Index Return |
-1.20 |
2.13 |
-2.96 |
1.20 |
3.07 |
Source: RBI, Acuité Research;
Note: Net injection (+) and Net absorption (-)
Source: RBI
Birabrata Panda
Sr. Statistician/Economist
 +91 99698 98000
 info@acuite.in
 Follow us
 +91 22 49294000
 DOWNLOAD