Key Highlights:
Liquidity
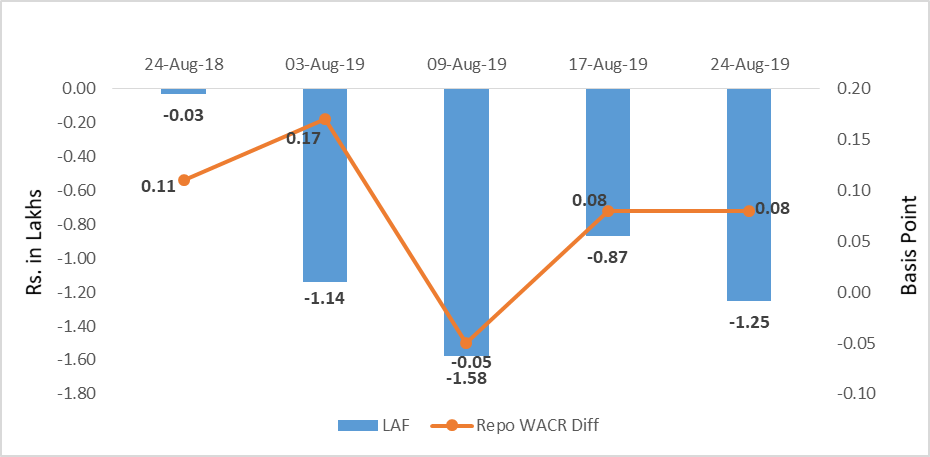
The call money rate during the fourth week of August stands 5.32%, which is eight bps lower than the repo rate. However, average liquidity in the system has increased to Rs. 1.25 lakh crore over a week time. Excess liquidity is result of waning credit offtake. Over a fortnight, the credit offtake has subsided by 60 bps to 11.65% during the first fortnight of August 2019. Growth in deposit, on the other hand, remains healthy at 10.2%.
Capital Market
In the global capital market, the yield of advance countries has been falling on account of strong demand. The 10-year US sovereign bond has declined to twelve month low. Other negative yielding bonds are also on the downward trend. However, the recently released some high frequency data in the US such as job less claim and crude oil inventory has been showing strong economic fundamental. This is expected to give positive sentiment in financial market as well. On the domestic front, the 10-year Indian sovereign yield has softened by 12 bps to 6.57% over a week. The domestic yield has been volatile due to weak macro indicator and economic booster package.
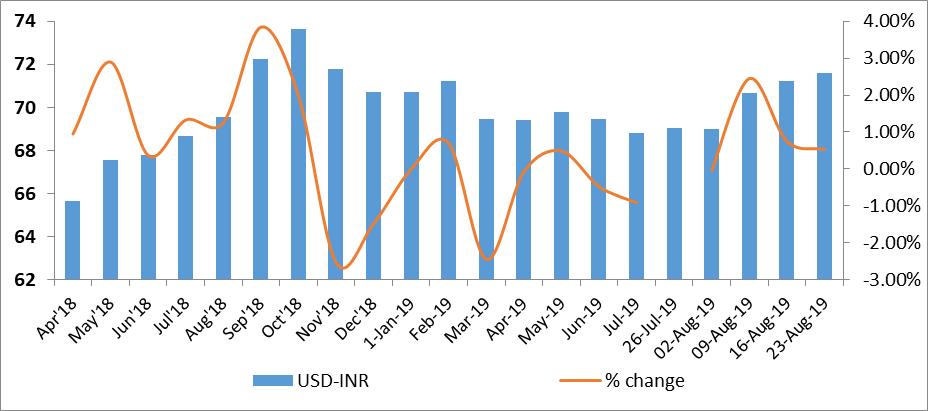
Currency Trend
In the currency market, the emerging economies’ currencies continue to remain weak on account of global economic uncertainty and expansionary monetary policy. The US dollar has been strengthening against the EUR. This will further weaken the currency of emerging economies. Indian rupee is currently hovering at 71.7 against the US dollar.
Interest rates and ratio:
|
Interest Rate |
Aug 24 |
July 26 |
Aug 2 |
Aug 9 |
Aug 16 |
Aug 23 |
|
2018 |
2019 |
2019 |
2019 |
2019 |
2019 |
|
|
Policy Repo Rate |
6.5 |
5.75 |
5.75 |
5.40 |
5.40 |
5.40 |
|
Call Money Rate (WA) |
6.39 |
5.59 |
5.58 |
5.45 |
5.32 |
5.32 |
|
364-Day Treasury Bill Yield |
7.32 |
5.98 |
5.94 |
5.85 |
5.77 |
5.74 |
|
2-Yr Indian G-Sec |
7.76 |
6.01 |
5.91 |
5.9 |
5.9 |
5.9 |
|
10-Yr Indian G-Sec |
7.86 |
6.62 |
6.5 |
6.64 |
6.69 |
6.57 |
|
10-Yr US G-Sec |
1.52 |
1.84 |
1.75 |
1.56 |
1.53 |
1.52 |
|
AAA (Indian corporate) |
8.65 |
7.76 |
7.5 |
6.96 |
7.61 |
7.37 |
|
Spread in bps (10Yr Indian- US) |
634 |
478 |
475 |
508 |
516 |
505 |
|
Credit/Deposit Ratio |
75.36 |
- |
76.34 |
- |
76.36 |
- |
|
USD LIBOR (3 month) |
1.9181 |
2.3504 |
2.1043 |
2.0953 |
2.0959 |
2.0936 |
|
Forward Premia of US$ 1-month |
4.62 |
4 |
3.98 |
3.74 |
3.7 |
4.02 |
|
US$ 3-month |
4.45 |
4.09 |
4.09 |
3.86 |
3.9 |
4.24 |
|
US$ 6-month |
4.38 |
4.31 |
4.18 |
3.94 |
3.96 |
4.22 |
Acuité Portfolio Debt Instrument Benchmark
Estimates (as on Sep, 03 2019):
|
Category |
10-Yr Corporate Yield to Maturity |
|
AAA* |
NA |
|
AA+ |
8.04% |
|
AA |
8.65% |
|
|
Deposit (In Rs. Lakh Cr) |
Bank Credit (In Rs. Lakh Cr) |
|
As on Aug 16,2019 |
126.8 |
96.83 |
|
As on July 19,2019 |
126.49 |
96.57 |
|
As on Aug 17,2018 |
115.11 |
86.73 |
|
YTD (% change) |
0.25% |
0.27% |
|
YoY (% change) |
10.16% |
11.65% |
Money Market Performance
|
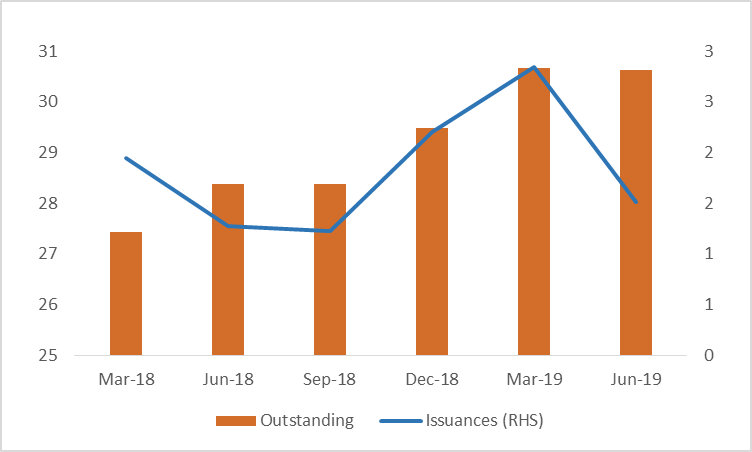
Commercial Paper (Fortnight): |
Outstanding (In Rs. Billion) |
Amount issued (In Rs. Billion) |
|
30-Jun-19 |
5,039.40 |
1076.9 |
|
15-Jun-19 |
5,561.80 |
1078.7 |
|
30-Jun-18 |
4,918.30 |
1267.3 |
|
% Change (MoM) |
-9.39% |
-0.17% |
|
% Change (YoY) |
2.46% |
-15.02% |
Indices
|
|
24-Aug-18 |
02-Aug-19 |
09-Aug-19 |
16-Aug-19 |
23-Aug-19 |
|
NSE Index |
11,557.10 |
10,997.35 |
11,109.65 |
11,047.80 |
10,829.35 |
|
NSE Index Return |
0.75 |
-2.54 |
1.02 |
-0.56 |
-1.98 |
|
BSE Index |
38,251.80 |
37,118.22 |
37,581.91 |
37,350.33 |
36,701.16 |
|
BSE Index Return |
0.80 |
-2.02 |
1.25 |
-0.62 |
-1.74 |
 +91 99698 98000
 info@acuite.in
 Follow us
 +91 22 49294000
 DOWNLOAD