Key Highlights:
Liquidity
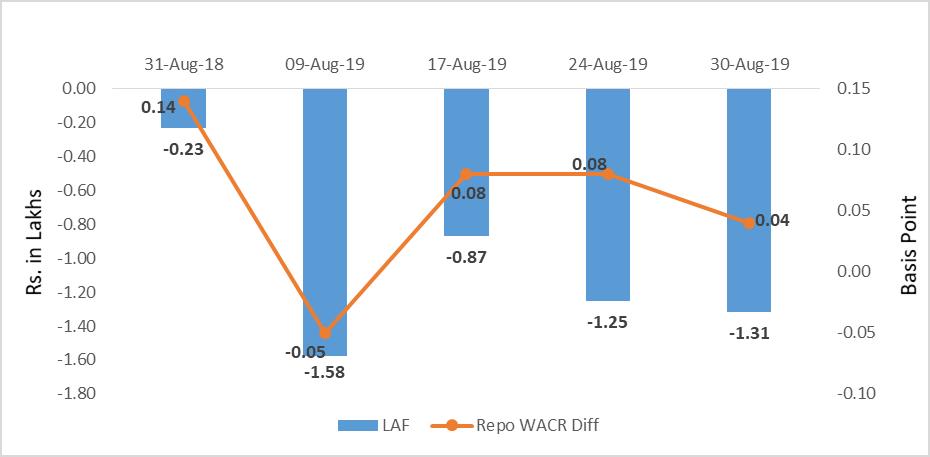
The weighted average call money rate has marginally increased to 5.36%, which is four bps lower than the repo rate. However, in view of mild credit offtake and robust government expenditure, the overall liquidity in system has further increased to Rs. 1.32 lakh crore during the last week of August 2019. This has reached Rs. 1.63 lakh crore as on September 9, 2019. This is indicating that the commercial banks being under pressure of low offtake may further trim their lending rates.
Capital Market
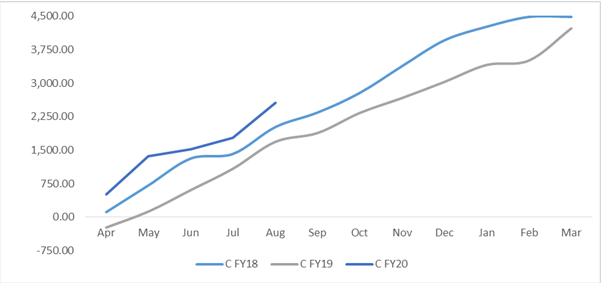
In the global sovereign debt market, higher supply of sovereign debt along with economic uncertainty has been pushing the sovereign yield up. The 10-year US G-sec that was hovering at 1.50% for past four weeks has been moving up. On the domestic front, 10-year G-sec has increased by thirteen bps to 6.70%. Central government’s debt issuance has increased by 120% in FY20 (as on August). The government has been front loading the system in order to change the market sentiment.
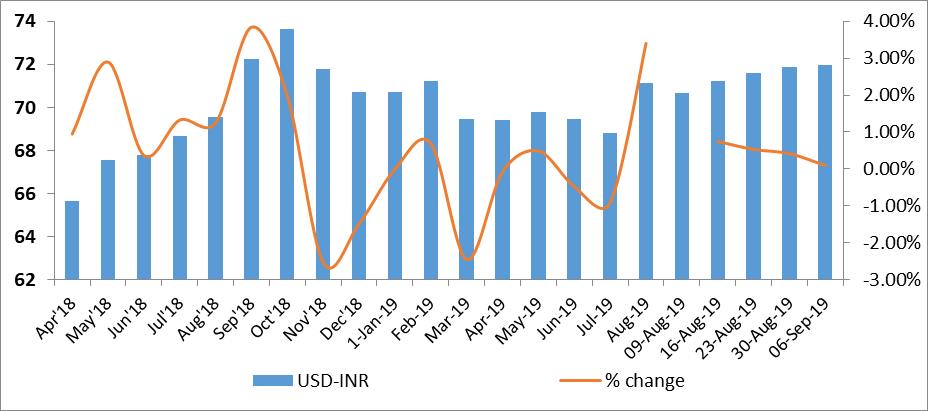
Currency Trend
In the currency market, the currencies of emerging economies were highly volatile in response to the devaluation of Chinese Yuan. However, market’s reaction to the currency war seems to be waning. The currencies of emerging market are strengthening against the US dollar. The Indian rupee has depreciated by 10% to 71.9 during the last week of August. However, the pace of depreciation has been easing.
Interest rates and ratio:
|
Interest Rate |
Aug.,31 |
Aug.,2 |
Aug.,9 |
Aug.,16 |
Aug.,23 |
Aug.,30 |
|
2018 |
2019 |
2019 |
2019 |
2019 |
2019 |
|
|
Policy Repo Rate |
6.50 |
5.75 |
5.4 |
5.40 |
5.40 |
5.40 |
|
Call Money Rate (WA) |
6.36 |
5.58 |
5.45 |
5.32 |
5.32 |
5.36 |
|
364-Day Treasury Bill Yield |
7.33 |
5.94 |
5.85 |
5.77 |
5.74 |
5.72 |
|
2-Yr Indian G-Sec |
7.88 |
5.91 |
5.90 |
5.90 |
5.90 |
5.78 |
|
10-Yr Indian G-Sec |
7.95 |
6.5 |
6.64 |
6.69 |
6.57 |
6.70 |
|
10-Yr US G-Sec |
2.94 |
1.75 |
1.56 |
1.53 |
1.50 |
1.56 |
|
AAA (Indian corporate) |
8.66 |
7.5 |
6.96 |
7.61 |
7.37 |
7.70 |
|
Spread in bps (10Yr Indian- US) |
501 |
475 |
508 |
516 |
507.1 |
514 |
|
Credit/Deposit Ratio |
75.39 |
76.34 |
.. |
76.36 |
.. |
.. |
|
USD LIBOR (3 month) |
1.9200 |
2.1043 |
2.0953 |
2.0959 |
2.0936 |
2.0866 |
|
Forward Premia of US$ 1-month |
4.40 |
3.98 |
3.74 |
3.70 |
4.02 |
3.85 |
|
US$ 3-month |
4.34 |
4.09 |
3.86 |
3.9 |
4.24 |
4.18 |
|
US$ 6-month |
4.22 |
4.18 |
3.94 |
3.96 |
4.22 |
4.24 |
Source: RBI, Investing.com
Acuité Portfolio Debt Instrument Benchmark Estimates (as on Sep, 09 2019):
|
Category |
10-Yr Corporate Yield to Maturity |
|
AAA* |
NA |
|
AA+ |
8.04% |
|
AA |
8.65% |
|
|
Deposit (In Rs. Lakh cr) |
Bank Credit (In Rs. Lakh cr) |
|
As on Aug 16,2019 |
126.8 |
96.83 |
|
As on July 19,2019 |
126.49 |
96.57 |
|
As on Aug 17,2018 |
115.11 |
86.73 |
|
YTD (% change) |
0.25% |
0.27% |
|
YoY (% change) |
10.16% |
11.65% |
Money Market Performance
|
Commercial Paper (Fortnight): |
Outstanding (In Rs. Billion) |
Amount issued (In Rs. Billion) |
|
30-Jun-19 |
5,039.40 |
1076.9 |
|
15-Jun-19 |
5,561.80 |
1078.7 |
|
30-Jun-18 |
4,918.30 |
1267.3 |
|
% Change (MoM) |
-9.39% |
-0.17% |
|
% Change (YoY) |
2.46% |
-15.02% |
Indices
|
|
31-Aug-18 |
09-Aug-19 |
16-Aug-19 |
23-Aug-19 |
30-Aug-19 |
|
NSE Index |
11,680.50 |
11,109.65 |
11,047.80 |
10,829.35 |
11,023.25 |
|
NSE Index Return |
1.07 |
1.02 |
-0.56 |
-1.98 |
1.79 |
|
BSE Index |
38,645.07 |
37,581.91 |
37,350.33 |
36,701.16 |
37,332.79 |
|
BSE Index Return |
1.03 |
1.25 |
-0.62 |
-1.74 |
1.72 |
Source: RBI, Acuité Research;
Note: Net injection (+) and Net absorption (-)
Source: Acuité Research, RB
Commodity Price Index (3 Month Moving Average):
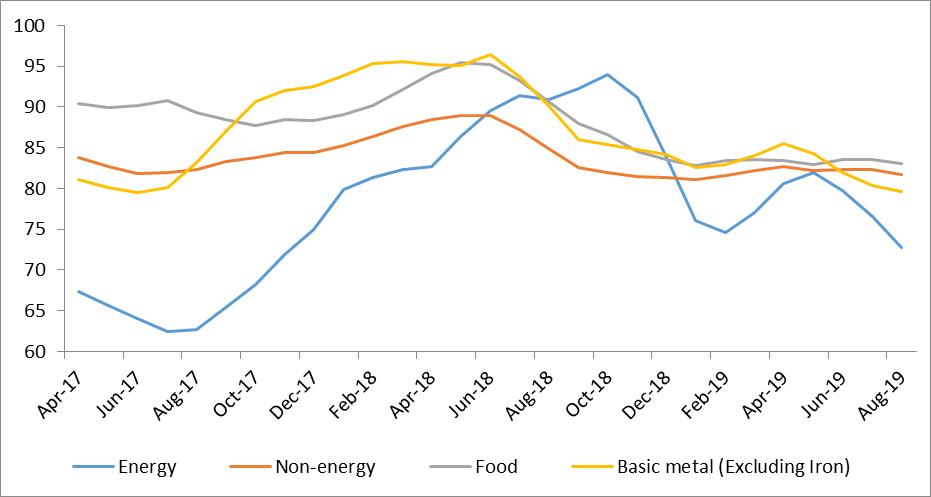
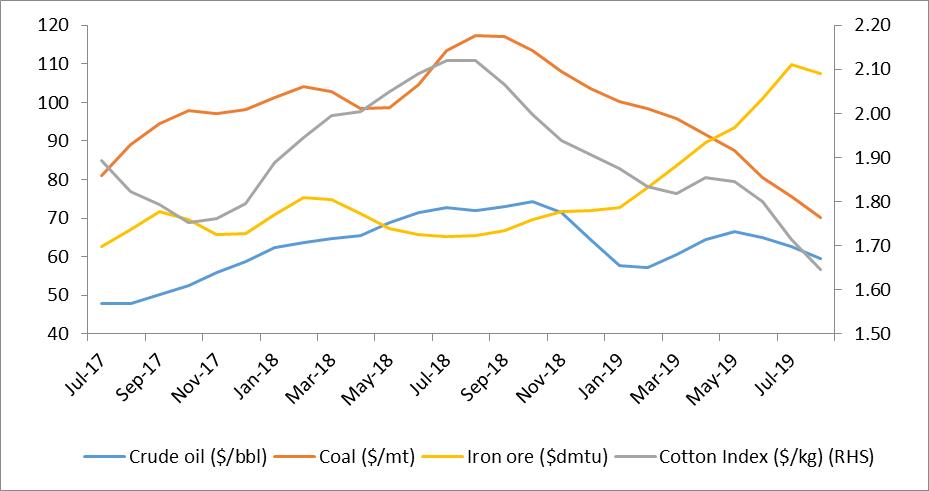
Source: RBI, Acuité Research
 +91 99698 98000
 info@acuite.in
 Follow us
 +91 22 49294000
 DOWNLOAD