Key Highlights:
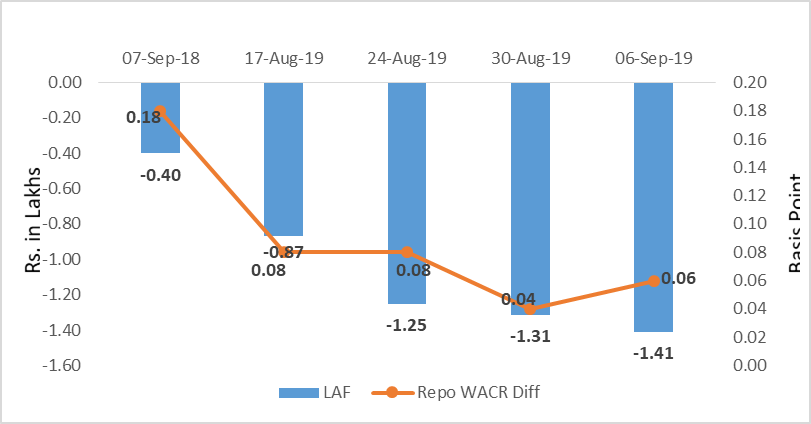
Liquidity
The surplus liquidity in banking system has surged up to Rs. 1.41 lakh crore during the first week of September 2019. On account of excess liquidity in the system, the weighted average call money rate is hovering around 5.34% for past four weeks. However, there is a sign of improvement during the third week of September as the surplus liquidity has reduced to Rs. 45,000 crore. The overall liquidity condition is likely to improve in coming weeks on account of festive session. Moreover, fall in deposit growth to 9.7% is indicating a further improvement in the liquidity condition.
Capital Market
On the global capital market, the 10-year US sovereign yield has inched up to 1.9% during the first week of Sept 2019. In the European Union, ECB has trimmed its deposit rate by 10 bps to -.5%. Moreover, QE program of 20 billion euro monthly also on the card of the central bank. Going ahead, this will infuse liquidity in the global financial system. Moreover, Fed’s next FOMC meeting is due on this week. These factors are likely to dominate the sovereign debt market in coming weeks. On the domestic market front, the 10-year Indian G-sec stands at 6.70% for past two weeks. The FOMC decision will be crucial for the future trend of the sovereign yield.
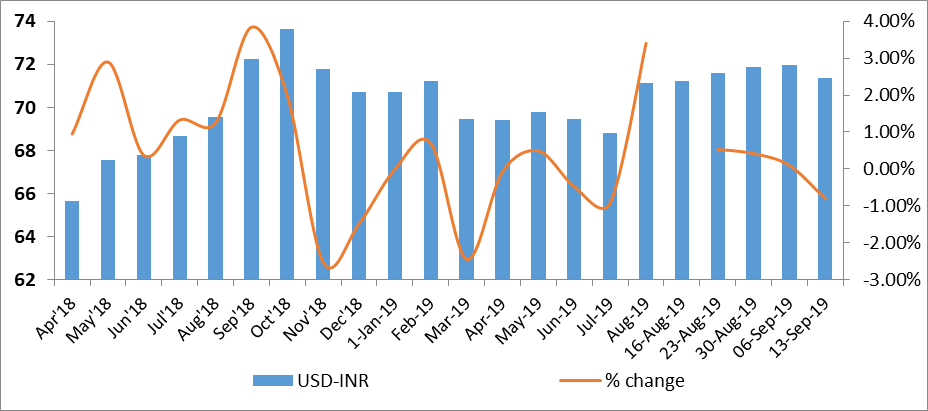
Currency Trend
The currency market seems to be recovering after a month long volatility. The Indian rupee has shown a sign of improvement with 0.8% appreciation over the week time. However, recent attack on Saudi oil tank will volatile oil price and there by currency market as well. An accommodative stance of ECB and Fed will have a positive impact on the Indian rupee.
Interest rates and ratio:
|
Interest Rate |
Sep.,07 |
Aug.,9 |
Aug.,16 |
Aug.,23 |
Aug.,30 |
Sep.,06 |
|
2018 |
2019 |
2019 |
2019 |
2019 |
2019 |
|
|
Policy Repo Rate |
6.5 |
5.4 |
5.4 |
5.40 |
5.40 |
5.40 |
|
Call Money Rate (WA) |
6.32 |
5.45 |
5.32 |
5.32 |
5.36 |
5.34 |
|
364-Day Treasury Bill Yield |
7.52 |
5.85 |
5.77 |
5.74 |
5.72 |
5.69 |
|
2-Yr Indian G-Sec |
8.00 |
5.90 |
5.90 |
5.90 |
5.78 |
5.77 |
|
10-Yr Indian G-Sec |
7.98 |
6.64 |
6.69 |
6.57 |
6.70 |
6.73 |
|
10-Yr US G-Sec |
3.00 |
1.56 |
1.53 |
1.5 |
1.56 |
1.9 |
|
AAA (Indian corporate) |
8.85 |
6.96 |
7.61 |
7.37 |
7.70 |
8.01 |
|
Spread in bps (10Yr Indian- US) |
498.1 |
508 |
516 |
507 |
514 |
483 |
|
Credit/Deposit Ratio |
76.04 |
76.36 |
75.75 |
|||
|
USD LIBOR (3 month) |
1.9188 |
2.0953 |
2.0959 |
2.0936 |
2.0866 |
2.0976 |
|
Forward Premia of US$ 1-month |
4.51 |
3.74 |
3.7 |
4.02 |
3.85 |
4.18 |
|
US$ 3-month |
4.42 |
3.86 |
3.9 |
4.24 |
4.18 |
4.24 |
|
US$ 6-month |
4.27 |
3.94 |
3.96 |
4.22 |
4.24 |
4.28 |
Acuité Portfolio Debt Instrument Benchmark
Estimates (as on Sep, 16 2019):
|
Category |
10-Yr Corporate Yield to Maturity |
|
AAA* |
NA |
|
AA+ |
8.04% |
|
AA |
8.65% |
|
|
Deposit (In Rs. Lakh cr) |
Bank Credit (In Rs. Lakh cr) |
|
As on Aug 30,2019 |
127.80 |
96.81 |
|
As on Aug 02,2019 |
127.45 |
97.29 |
|
As on Aug 31,2018 |
116.47 |
87.81 |
|
YTD (% change) |
0.28% |
-0.50% |
|
YoY (% change) |
9.73% |
10.25% |
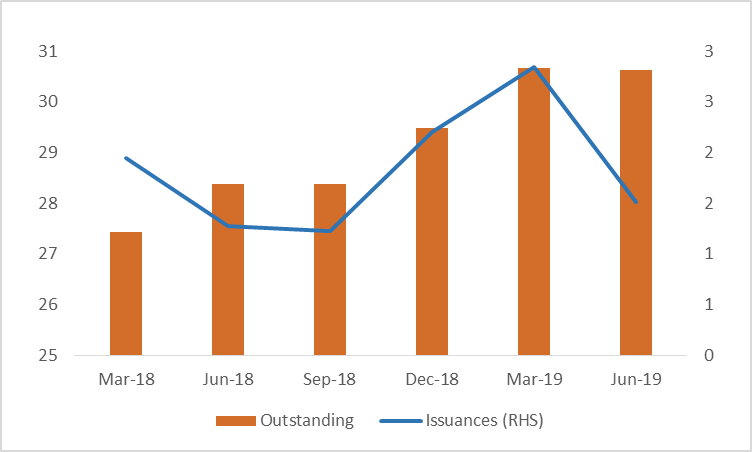
Money Market Performance
|
Commercial Paper (Fortnight): |
Outstanding (In Rs. Billion) |
Amount issued (In Rs. Billion) |
|
30-Jun-19 |
5,039.40 |
1076.9 |
|
15-Jun-19 |
5,561.80 |
1078.7 |
|
30-Jun-18 |
4,918.30 |
1267.3 |
|
% Change (MoM) |
-9.39% |
-0.17% |
|
% Change (YoY) |
2.46% |
-15.02% |
Indices
|
|
07-Sep-18 |
16-Aug-19 |
23-Aug-19 |
30-Aug-19 |
06-Sep-19 |
|
NSE Index |
11,589.10 |
11,047.80 |
10,829.35 |
11,023.25 |
10,946.20 |
|
NSE Index Return |
-0.78 |
-0.56 |
-1.98 |
1.79 |
-0.7 |
|
BSE Index |
38,389.82 |
37,350.33 |
36,701.16 |
37,332.79 |
36,981.77 |
|
BSE Index Return |
-0.66 |
-0.62 |
-1.74 |
1.72 |
-0.94 |
Liquidity Operation by RBI:
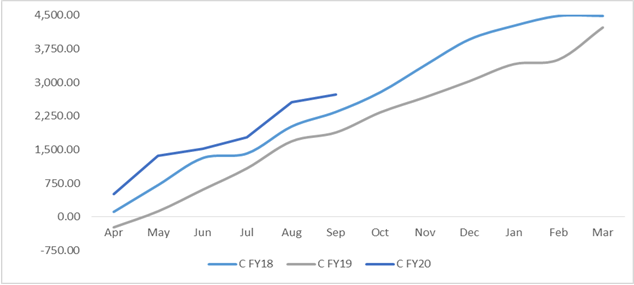
Corporate debt (in Rs. Lakh Cr):
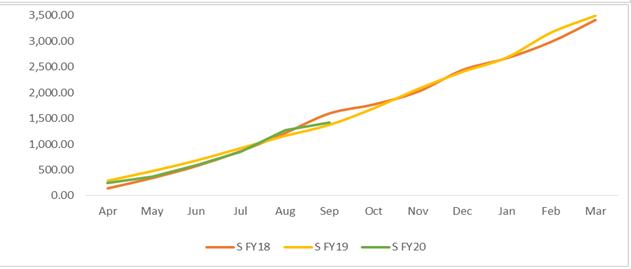
Net Debt Issuance by Centre and State Government (Rs. Billion):
Source:
Acuité Research, RB
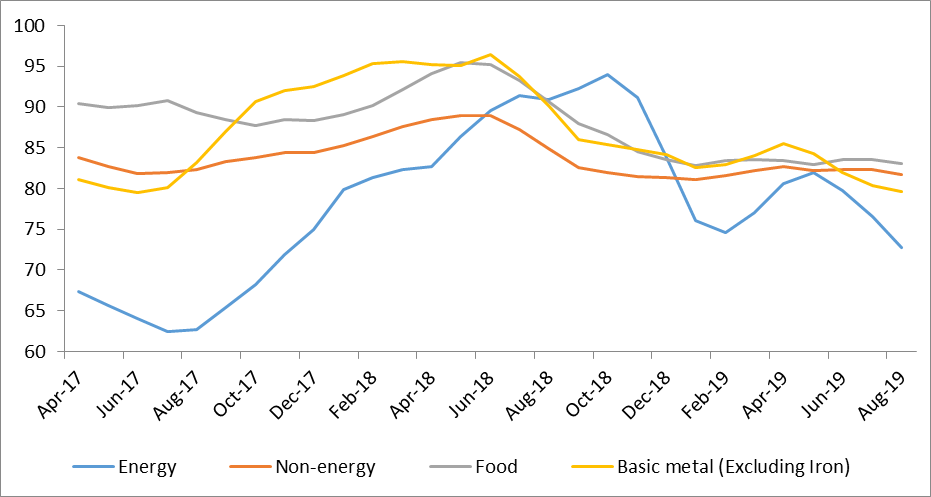
Commodity Price Index (3 Month Moving Average):
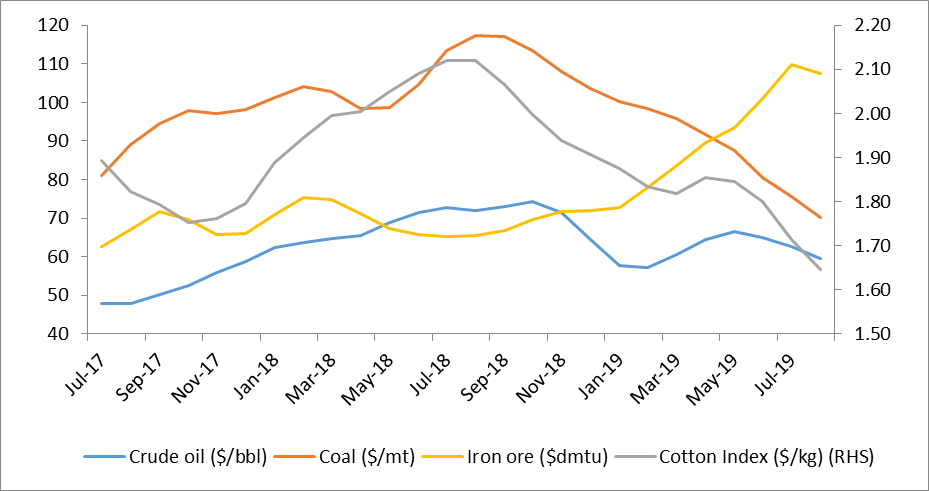
Commodity Price Movement (3 Month Moving Average):
USD-INR Movement:
 +91 99698 98000
 info@acuite.in
 Follow us
 +91 22 49294000
 DOWNLOAD