Key Highlights:
Liquidity
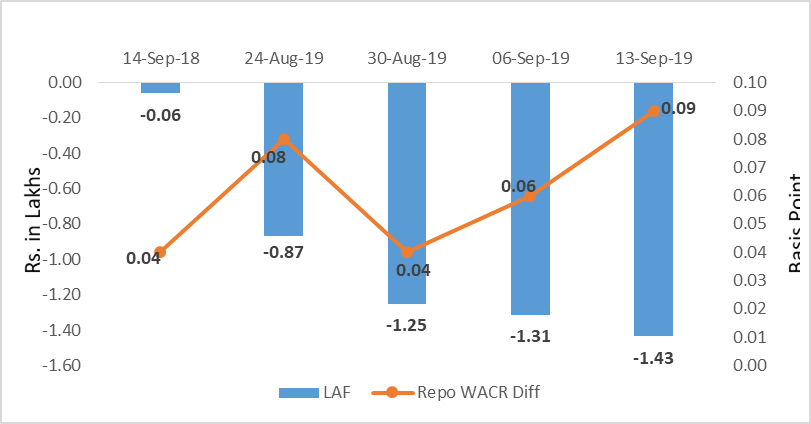
The overall liquidity in
the banking sector has increased to Rs. 1.43 lakh crore during the second week
of September 2019. As a result of surfeit in liquidity in the system, the
weighted average call money rate has further subsided to 5.31%. However, the
surplus liquidity in the system has declined to Rs. 43,000 as on September 23,
2019. The liquidity condition is likely to improve during the last week of
September on account of GST tax filling for the second quarter. Moreover,
credit offtake that has been subsiding for past few weeks is expected to
reverse with the upcoming festive season.
Capital
Market
In the global capital
market, the 10-year US sovereign yield has subsided from a seven-week high of
1.92% to 1.72% over the week period. As the FOMC has trimmed the fed rate by 25
bps during the last week’s meeting, the G-sec yield is expected to decline further.
On the domestic market side, the 10-year Indian sovereign yield has increased
to 6.77%. The domestic capital market is expected to remain volatile as
government’s booster package for the revival of economy is threatening the
fiscal target.
Currency
Trend
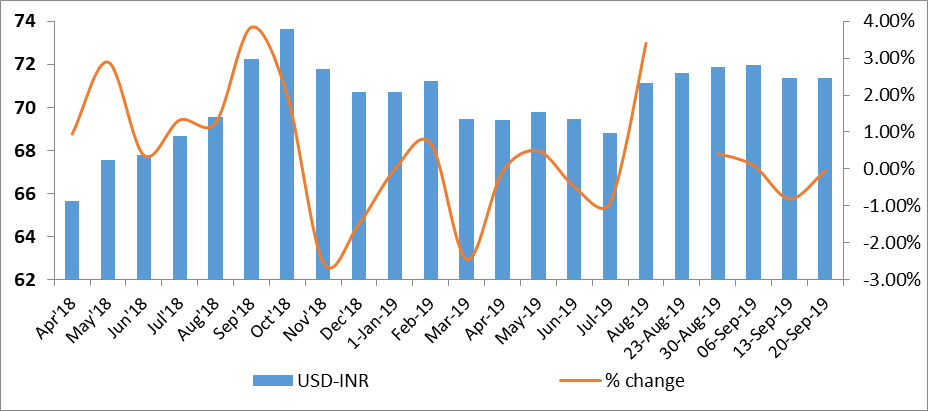
In
the currency market, the currency of emerging markets has been gaining against
the US dollar. The Indian rupee has been appreciating for past two weeks after
reaching multi weeks low of 71.9 during the first week of September. The
accommodative monetary policy in the west will lead to higher capital inflows
to the emerging markets. Therefore, currencies of the emerging markets are
expected to strengthen against the USD.
Interest rates and ratio:
|
Interest Rate |
Sep.,14 |
Aug.,16 |
Aug.,23 |
Aug.,30 |
Sep.,06 |
Sep.,13 |
|
2018 |
2019 |
2019 |
2019 |
2019 |
2019 |
|
|
Policy Repo Rate |
6.5 |
5.4 |
5.4 |
5.40 |
5.40 |
5.40 |
|
Call Money Rate (WA) |
6.46 |
5.32 |
5.32 |
5.36 |
5.34 |
5.31 |
|
364-Day Treasury Bill Yield |
7.68 |
5.77 |
5.74 |
5.72 |
5.69 |
5.65 |
|
2-Yr Indian G-Sec |
7.93 |
5.90 |
5.90 |
5.78 |
5.77 |
5.73 |
|
10-Yr Indian G-Sec |
8.07 |
6.69 |
6.57 |
6.70 |
6.73 |
6.77 |
|
10-Yr US G-Sec |
3.07 |
1.53 |
1.5 |
1.56 |
1.90 |
1.72 |
|
AAA (Indian corporate) |
8.92 |
7.61 |
7.37 |
7.70 |
8.01 |
7.85 |
|
Spread in bps (10Yr Indian- US) |
500.3 |
516 |
507 |
514 |
483 |
504.8 |
|
Credit/Deposit Ratio |
76.08 |
76.36 |
- |
75.75 |
- |
- |
|
USD LIBOR (3 month) |
1.9151 |
2.0959 |
2.0936 |
2.0866 |
2.0976 |
2.0883 |
|
Forward Premia of US$ 1-month |
4.85 |
3.7 |
4.02 |
3.85 |
4.18 |
4.57 |
|
US$ 3-month |
4.65 |
3.9 |
4.24 |
4.18 |
4.24 |
4.43 |
|
US$ 6-month |
4.48 |
3.96 |
4.22 |
4.24 |
4.28 |
4.48 |
Acuité Portfolio Debt Instrument Benchmark
Estimates (as on Sep 23rd 2019):
|
Category |
10-Yr Corporate Yield to Maturity |
|
AAA* |
NA |
|
AA+ |
8.03% |
|
AA |
8.69% |
|
|
Deposit (In Rs. Lakh cr) |
Bank Credit (In Rs. Lakh cr) |
|
As on Aug 30,2019 |
127.80 |
96.81 |
|
As on Aug 02,2019 |
127.45 |
97.29 |
|
As on Aug 31,2018 |
116.47 |
87.81 |
|
YTD (% change) |
0.28% |
-0.50% |
|
YoY (% change) |
9.73% |
10.25% |
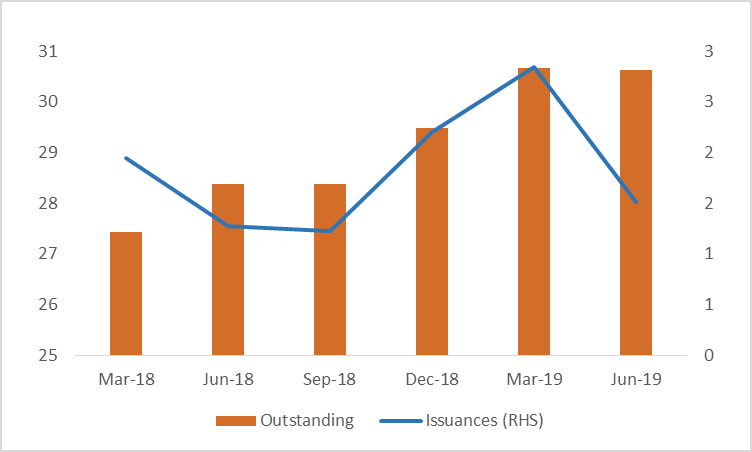
Money Market Performance
|
Commercial Paper (Fortnight): |
Outstanding (In Rs. Billion) |
Amount issued (In Rs. Billion) |
|
30-Jun-19 |
5,039.40 |
1076.9 |
|
15-Jun-19 |
5,561.80 |
1078.7 |
|
30-Jun-18 |
4,918.30 |
1267.3 |
|
% Change (MoM) |
-9.39% |
-0.17% |
|
% Change (YoY) |
2.46% |
-15.02% |
Indices
|
|
14-Sep-18 |
23-Aug-19 |
30-Aug-19 |
06-Sep-19 |
13-Sep-19 |
|
NSE Index |
11,515.20 |
10,829.35 |
11,023.25 |
10,946.20 |
11,075.90 |
|
NSE Index Return |
-0.64 |
-1.98 |
1.79 |
-0.7 |
1.18 |
|
BSE Index |
38,090.64 |
36,701.16 |
37,332.79 |
36,981.77 |
37,384.99 |
|
BSE Index Return |
-0.78 |
-1.74 |
1.72 |
-0.94 |
1.09 |
Birabrata Panda
Sr. Statistician/Economist
 +91 99698 98000
 info@acuite.in
 Follow us
 +91 22 49294000
 DOWNLOAD