Sep-21 IIP: Slowdown visible as favourable base fades

KEY TAKEAWAYS

  • IIP growth decelerated sharply to 3.1% YoY in Sep-21 from 12.0% in Aug-21.
  • Overall industrial production saw a 2.6% MoM contraction in Sep-21 - the first sizeable contraction post the 2nd wave of Covid in Apr-May 2021.
  • While festive related ramp up played a supportive role, adverse weather developments and some spillover of global energy crisis managed to offset the latter and dampen sequential industrial activity.
  • Nevertheless, Sep-21 IIP is now 4.1% above Sep-19 levels, reflecting ongoing recovery in overall industrial activity compared to pre Covid levels.
  • Going forward, we believe that pent-up demand, vaccination coverage, government spending, and some support from exports would help buoy sequential industrial activity.
  • Downside risks from global supply chain disruptions, elevated commodity prices, potential financial market volatility from monetary policy normalization by key central banks, and future waves of Covid (if any), will however, continue to remain.
  • On balance, we continue to retain our FY22 GDP growth forecast at 10.0% with possible downside risks.

India’s IIP growth decelerated sharply to 3.1% YoY in Sep-21 from 12.0% (revised upward from preliminary estimate of 11.9%) in Aug-21. While market participants were expecting industrial activity to moderate due to fading favorable statistical base, the actual annualized IIP print turned out to be weaker than consensus expectation of around 4.8% YoY. Moreover, it was also accompanied by a 2.6% MoM contraction in sequential activity - the first sizeable contraction in sequential industrial production post the second wave of Covid in Apr-May 2021, reflecting some slowdown in industrial recovery.

Key Takeaways

  • On sectoral basis, broad-based contraction was recorded with electricity and mining sectors posting a sharp sequential contraction of 11.0% MoM and 8.4% MoM respectively. In comparison, the manufacturing sector posted a mild contraction of 0.5% MoM. This highlights the temporary disruption from 35% excess rainfall in the month of Sep-21 that predominantly impacted sectors like mining and electricity, the latter mostly due to shortage of coal in thermal stations.
  • Out of 23 manufacturing industries covered by the IIP, 11 posted a sequential contraction while 12 saw an expansion. Within the manufacturing space, the top 3 front runners included – Computer, Electronics & Optical Products (+17.0% MoM), Electrical Equipment (+11.1% MoM) and Transport Equipment (+6.3% MoM). On the other hand, the laggards included Paper and Paper Products (-7.0% MoM), Food Products (-5.2% MoM), Non-Metallic Mineral Products (-4.8% MoM), besides others.
  • On use-based basis, consumer durables and capital goods posted a sequential expansion of 6.7% MoM and 0.5% MoM respectively. All the other categories saw a contraction in production activity. Despite the sequential expansion in consumer durables that in our opinion reflects seasonal festival ramp up, adverse statistical base effect pulled annualized growth in this category significantly lower.
  • Sifting through the pandemic induced base effects, we note that Sep-21 IIP is 4.1% higher vis-à-vis Sep-19 levels, thereby underscoring the recovery in overall industrial activity on a 2-year basis. However, the cumulative industrial output for Apr-Sep’21 is still marginally lower by 2.2% as against Apr-Sep’19, primarily reflecting an incomplete and uneven recovery particularly in the manufacturing space.

Outlook

In our previous month’s coverage on IIP, we had highlighted the likelihood of annualized IIP growth drifting lower into single digits amidst fading of favorable statistical base effect. The Sep-21 print has reinforced that expectation while also highlighting the impact of few temporary disruptions like adverse weather conditions and the global energy crisis. The overall trajectory of IIP is very well reflected in our proprietary AMEP index (Acuité Macroeconomic Performance Index), which after having recovered post the disruption caused by the second Covid wave, is showing signs of plateauing. (Chart 2)

Going forward, to correctly interpret growth scenario, it will be critical to look at sequential momentum, which we expect to remain supportive amidst:

  • Festive demand: The ongoing festive season in India is believed to have generated record sales for both online and offline retailers as per media reports. This highlights the impact of pent-up demand that is gradually getting unlocked with the receding wave of Covid and phasing out of state level lockdown restrictions.
  • Progress on vaccination: At present, India has inoculated around 54% of its population with single dose and fully vaccinated around 26%. As coverage nears 2/3rd of the population by year-end, it should provide a strong boost to consumer sentiment and demand recovery.

  • Government spending: As of Sep-21, central government’s cumulative expenditure touched 46.7% of FY22 budget estimates vis-à-vis 42.1% of actuals in the corresponding period in FY21, with a focus on capital expenditure. Meanwhile, revenue expenditure is now likely to get disbursed at a higher pace in H2 FY22 to meet budgetary targets as well as demand for unallocated items (like Covid related expense, fertilizer subsidy, wage hikes, MGNREGS enhancement, etc.). Bunching up of government spending in the second half of the year is likely to be supportive of rural demand as well as overall capital formation.
  • Exports: Despite some moderation in expectation of global growth in recent months, exports continue to appear strong, aided by robust external demand as well as the inflationary impact.

On the downside, we continue to be mindful of risks from global supply chain disruptions along with elevated commodity prices that can dampen demand and potential financial market volatility as key central banks begin to normalize their monetary policy. Another wave of Covid cannot be ruled out, though the economic impact could be much lower on account of vaccine penetration and existing seroprevalence.

As such, we continue to retain our FY22 growth forecast at 10.0% with downside risks.


Annexure

Chart 1: IIP for H1 FY22 still at -2.2% lower vs. pre-pandemic level


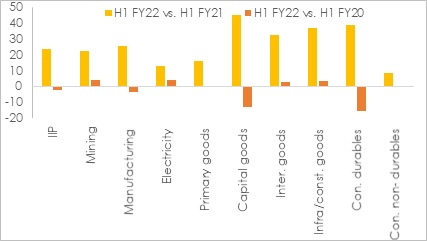
Chart 2: AMEP index serves as a predecessor to IIP index


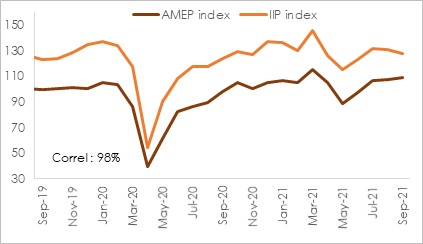
Table 1: IIP Growth at a glance


Weight 

Sep-20

Sep-21

Apr-Sep 
FY21

Apr-Sep 
FY22

IIP

100.0

1.0

3.1

-20.8

23.5

Sectoral Classification

Mining

14.4

1.4

8.6

-15.2

22.3

Manufacturing

77.6

0.4

2.7

-23.3

25.3

Electricity

8.0

4.9

0.9

-8.0

12.8

Use-Based Classification

Primary Goods

34.1

-1.5

4.6

-14.2

15.8

Capital Goods

8.2

-1.2

1.3

-40.2

44.9

Intermediate Goods

17.2

-0.4

4.9

-22.8

32.4

Infrastructure/Construction Goods

12.3

4.0

7.4

-24.8

36.9

Consumer Durables

12.8

5.3

-2.0

-39.0

38.4

Consumer Non-Durables

15.3

2.4

-0.5

-8.2

8.3