Sep-21 Trade Deficit: At a record high
KEY TAKEAWAYS
- India’s merchandise trade deficit widened sharply to an all-time high of USD 22.6 bn in Sep-21 from USD 13.8 bn in Aug-21.
- The increase in the deficit was led by record high imports in both oil and non-oil products, while exports remained broadly steady.
- The expansion of the merchandise trade deficit in Sep-21 is predominantly led by item wise deficit under Petroleum Products, Electronic Goods, and Agri & Allied Products.
- While some of the factors behind the record high trade deficit may fade out in the coming months, others like the vaccine led recovery in domestic demand could continue to linger for quarters ahead.
- We revise upwards our forecast for India’s FY22 current account deficit to USD 38 bn vis-a-vis USD 30 bn projected earlier (FY21 recorded a surplus of USD 24 bn).
India’s merchandise trade deficit widened to an all-time high of USD 22.6 bn in Sep-21 from USD 13.8 bn in Aug-21. While both exports and imports moved up in Sep-21, the massive increase in imports weighed upon the trade deficit.
Looking at the drivers of trade deficit in Sep-21, we find that:
Exports: Minor uptick in Sep-21, steady pickup in H1FY22
In value terms, merchandise exports rose marginally to USD 33.8 bn in Sep-21 from USD 33.3 bn in Aug-21, translating into an annualized growth of 22.6% YoY to mark the seventh consecutive month of strong growth, albeit with some moderation.
- Sequentially, the increase was led by exports of Petroleum Products (+USD 0.6 bn) and Chemical Products (+USD 0.2 bn). On the other hand, Gems & Jewellery and Engineering Goods registered a mild sequential decline (-USD 0.2 bn each).
- Non-oil exports stood almost flat at USD 28.5 bn in Sep-21, vs. USD 28.6 bn in Aug-21. While favorable base rendered a healthy annualized growth of 18.6% in case of core exports, we note that the export growth also looks rather robust at 26.2% even when compared to 2-year ago (Sep-19) i.e. pre pandemic levels.
- Robust external demand particularly in sectors such as chemicals, pharmaceuticals, engineering goods and two wheelers along with support from accommodative policies, gradual unlock by the states since Jun-21 and elevated commodity prices has clearly led to a structural improvement on the export front.
- On the domestic front, implementation of the PLI scheme will continue to support export growth momentum. Further, the new Foreign Trade Policy 2021-26 (likely to be announced in the second half of FY22) is expected to correct few imbalances on the export front and provide suitable incentives to the exporters for a further ramp up in their volumes. Nevertheless, the current energy crisis and raw material shortages in some sectors could have a mild impact on India’s export performance in the near term.
Imports: At an all-time high in Sep-21
Merchandise imports rose to a record high of USD 56.4 bn in Sep-21 from USD 47.1 bn in Aug-21, translating into an annualized growth of 84.8% YoY. At a granular level:
- Bulk of the sequential increase was driven by imports of Petroleum Products (+USD 5.8 bn), Electronic Items (+USD 1.0 bn), Chemical Products (+USD 0.9 bn), Agri & Allied Products (+USD 0.7 bn), Ores & Minerals (+USD 0.4 bn), Machinery Goods (+USD 0.4 bn), Plastic & Rubber (+USD 0.3 bn), and Base Metals (+USD 0.3 bn).
- On a monthly scale, four items stood at an all-time high level: Agri & Allied Products, Chemical Products, Electronic Goods, and Petroleum Products.
- Gems & Jewellery was the only category that saw a sequential drop (-USD 0.8 bn) in imports.
- Non-oil and non-gold imports (NO-NG)- a key indicator for domestic demand, also climbed abruptly by USD 5.1 bn to USD 33.8 bn. Such a strong sequential increase in NO-NG imports was last recorded in Jul-20 led by pent-up demand after the unlocking from the first Covid wave but the scale of the import spike was clearly larger this time around.
Outlook
The record expansion of the merchandise trade deficit in Sep-21 is predominantly led by item wise deficit under:
- Petroleum Products: The record high oil deficit of USD 12.5 bn in Sep-21 is somewhat perplexing as price of India Crude Basket was relatively ranged in last three months (Jul-21: USD 74 pb, Aug-21: USD 70 pb, and Sep-21: USD 73 pb). Hence, it highlights the likelihood of past orders getting delivered, fresh demand ahead of the festive season, or augmenting of strategic reserves.
- Electronic Items: The Indian festive season is typically marked by significant activity in purchase of consumer goods, esp. electronics. The record high electronics trade deficit of USD 5.7 bn manifests buildup of inventories ahead of the festive season sales.
- Agri & Allied Products: Although this is not a
major driver of the trade deficit, we nevertheless note the change in direction
from the usual surplus agri-commodity trade balance to a deficit (of USD 0.3
bn) recorded for the first time. This clearly points towards the role of edible
oil imports, which has seen a sharp run up in prices at a global level.
There are several factors behind the record high trade deficit: i) seasonality, ii) high commodity and particularly crude oil prices, iii) lingering Covid related disruption, iv) idiosyncratic demand, and v) sequential recovery in domestic demand. Some of these may fade out in the coming months. However, some, like the vaccine led recovery in domestic demand could continue to linger on for few quarters ahead.
While we expect overall exports to remain strong, there is evidence of a moderation in the sequential pace, which could reflect the marginal loss of momentum in global growth accompanied by substantial unevenness across countries (the IMF in its Oct-21 World Economic Outlook revised lower its forecast for World GDP growth to 5.9% from 6.0% earlier). The global energy supply chain disruption is the latest risk that needs monitoring besides the existing disruption in production of semiconductors.
As such, we revise upwards our forecast for India’s FY22 current account deficit to USD 38 bn vis-a vis USD 30 bn projected earlier (FY21 recorded a surplus of USD 24 bn).
Table 1: Key items within merchandise trade balance
| India's merchandise trade highlights (USD bn) |
|
Sep-20 |
Sep-21 |
Apr-Sep FY21 |
Apr-Sep FY22 |
| Exports |
27.5 |
33.8 |
125.6 |
198.0 |
| Petroleum Exports |
3.5 |
5.2 |
12.1 |
28.6 |
| Non-oil exports |
24.0 |
28.6 |
113.4 |
169.4 |
| Imports |
30.5 |
56.4 |
151.9 |
276.0 |
| Petroleum Imports |
5.8 |
17.4 |
32.0 |
72.5 |
| Gold Imports |
0.6 |
5.1 |
6.8 |
23.9 |
| NONG imports |
24.0 |
33.2 |
112.4 |
178.5 |
| Trade Balance |
-3.0 |
-22.6 |
-26.3 |
-77.5 |
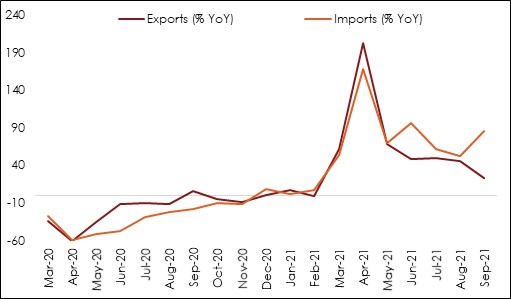
Chart 1: For five straight months, growth in imports has exceeded exports
 +91 99698 98000
 info@acuite.in
 Follow us
 +91 22 49294000
 DOWNLOAD