Key Highlights:
Q2 Economic Outlook
Market is awaiting a recovery of sorts and anticipating when the economic growth will regain its lost trajectory. The GDP growth in a downward trend for past five quarters had reached 5% in Q1FY20. The economic outlook is expected to remain steady in Q2 as well with 5.1% as per Acuité Projection. However, there is a higher risk towards the downward side as our major concern pertains to de-growth in manufacturing IIP. Manufacturing IIP and GVA are highly correlated with almost 80%. Moreover, fall/rise in IIP (manufacturing) result in sharp fall/rise in GVA (manufacturing). This is because, change in unit production of higher value adding sectors (such as automobile and electronic goods) are causing a substantial impact on the GVA. As per our analysis based on high frequency data, 4 out of 13 leading indicators are accelerating as compared to the previous year’s performance. Similarly, while comparing with the previous quarter, 7 indicators are performing better – indicating bottoming out scenario. Also worth noting are the signs of improvement seen in investment, which is expected to change the sentiment in coming quarters.
Liquidity
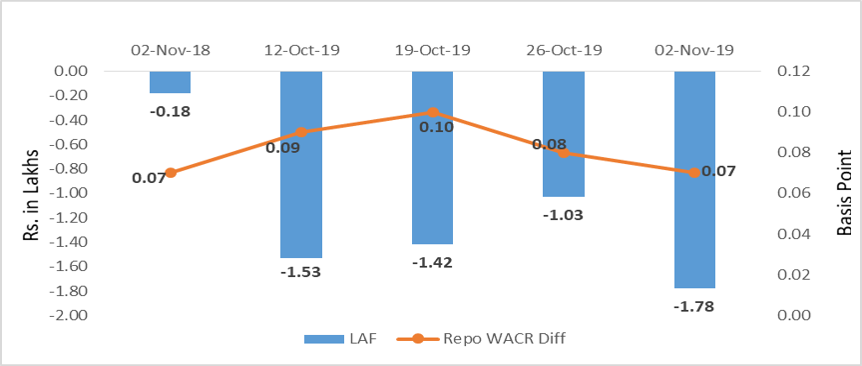
The spread between repo and weighted average call money has further narrow down to 7 bps during the last week of October 2019. The over-night lending rate now stands at 5.08% during the week. The surfeit liquidity in the system on the other hand has increased to Rs. 1.78 lakh crore (weekly average) during the week. The amount was Rs. 1.03 lakh crore a week earlier. The RBI has been managing the systematic liquidity through reverse repo as capital inflows has been piling up liquidity in the system. On the offtake side, the incremental credit to deposit has further improved to 16.5% during the second fortnight of October 2019, which was 4.8% during the previous fortnight.
Capital Market
On the capital market front, the 10-year Indian sovereign yield has been hovering at 6.5% for past four weeks. However, the sovereign debt market is highly volatile this week as India’s outlook was downgraded to negative by a global credit rating agency. Growth in government debt issuance has reduced to 45% in October, 2019 from 66% a month earlier. As the central government debt issuance is likely to remain low during the second half of the current financial year, we expect the yields to remain low. However, with the persisting negative economic outlook, the yield is likely to be volatile during the release of macro data, especially around last week of November. On the global front, the 10-year US G-Sec has increased to 1.94% during the last week of October, 2019 on the back of safe haven buying. The US sovereign yield has been strongly driven by the sentiment of US-China trade war.
Currency Trend
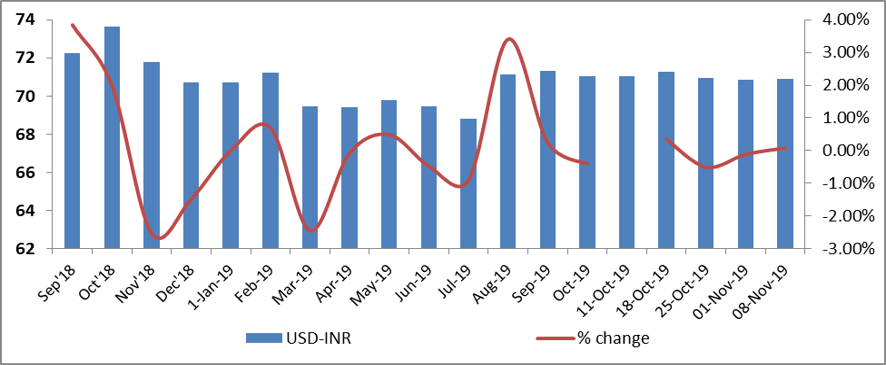
On the currency market front, the Indian rupee has
been steady at 70.9 for the past three weeks. The forex reserve has also surged
by $3.5 billion, closing at $446.01 billion during the reference week. As
mentioned, the currency pair has been witnessing some volatility in this week after
India’s sovereign rating outlook was downgraded.
Interest rates and ratio:
|
Interest Rate |
Nov 02 |
Oct 04 |
Oct 11 |
Oct 18 |
Oct 25 |
Nov 01 |
|
2018 |
2019 |
2019 |
2019 |
2019 |
2019 |
|
|
Policy Repo Rate |
6.50 |
5.15 |
5.15 |
5.15 |
5.15 |
5.15 |
|
Call Money Rate (WA) |
6.43 |
5.26 |
5.06 |
5.05 |
5.07 |
5.08 |
|
364-Day Treasury Bill Yield |
7.48 |
5.53 |
5.41 |
5.37 |
5.32 |
5.30 |
|
2-Yr Indian G-Sec |
7.43 |
5.75 |
5.67 |
5.64 |
5.67 |
5.62 |
|
10-Yr Indian G-Sec |
7.84 |
6.47 |
6.54 |
6.57 |
6.58 |
6.54 |
|
10-Yr US G-Sec |
3.18 |
1.73 |
1.75 |
1.80 |
1.71 |
1.94 |
|
AAA (Indian corporate) |
8.87 |
7.54 |
7.72 |
7.61 |
7.97 |
7.65 |
|
Spread in bps (10Yr Indian- US) |
784 |
474 |
479 |
477 |
658 |
654 |
|
Credit/Deposit Ratio |
73.1 |
- |
75.66 |
- |
75.81 |
- |
|
USD LIBOR (3 month) |
2.1746 |
1.8224 |
1.7926 |
1.8381 |
1.8028 |
1.5921 |
|
Forward Premia of US$ 1-month |
4.28 |
4.40 |
3.72 |
3.79 |
3.38 |
3.39 |
|
US$ 3-month |
4.17 |
3.87 |
3.80 |
3.71 |
3.61 |
3.70 |
|
US$ 6-month |
4.18 |
4.18 |
4.08 |
4.05 |
3.99 |
4.13 |
|
|
Deposit (In Rs. Lakh cr) |
Bank Credit (In Rs. Lakh cr) |
|
As on Oct 25,2019 |
129.78 |
98.39 |
|
As on Sep 27,2019 |
129.06 |
97.67 |
|
As on Oct 26,2018 |
117.71 |
90.34 |
|
YTD (% change) |
0.56% |
0.73% |
|
YoY (% change) |
10.25% |
8.91% |
|
Commercial Paper (Fortnight): |
Outstanding (In Rs. Billion) |
Amount issued (In Rs. Billion) |
|
30-Jun-19 |
5,039.40 |
1076.9 |
|
15-Jun-19 |
5,561.80 |
1078.7 |
|
30-Jun-18 |
4,918.30 |
1267.3 |
|
% Change (MoM) |
-9.39% |
-0.17% |
|
% Change (YoY) |
2.46% |
-15.02% |
Indices
|
|
02-Oct-18 |
11-Oct-19 |
18-Oct-19 |
25-Oct-19 |
01-Nov-19 |
|
NSE Index |
10,316.45 |
11,305.05 |
11,661.85 |
11,583.90 |
11,890.60 |
|
NSE Index Return |
-5.62 |
1.17 |
3.16 |
-0.67 |
2.65 |
|
BSE Index |
34,376.99 |
38,127.08 |
39,298.38 |
39,058.06 |
40,165.03 |
|
BSE Index Return |
-5.11 |
1.20 |
3.07 |
-0.61 |
2.83 |
Source: RBI, Acuité Research;
Note: Net injection (+) and Net absorption (-)
Source: RBI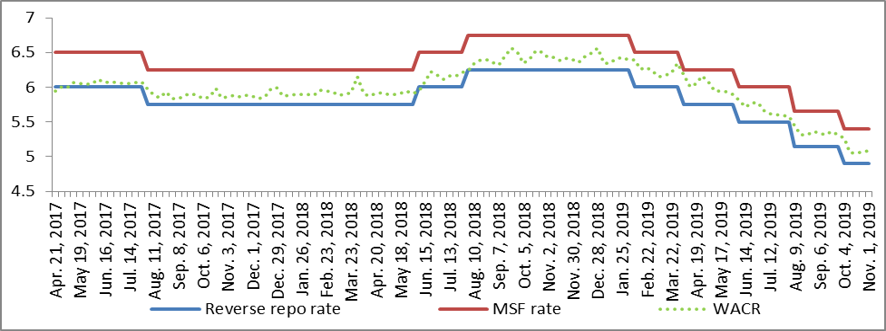
4.png)
3.png)
2.png)
6.png)
Birabrata Panda
Sr. Statistician/Economist
 +91 99698 98000
 info@acuite.in
 Follow us
 +91 22 49294000
 DOWNLOAD