Key Highlights:
Liquidity:
The weighted average call money rate has subsided to 5.67% during the first week of July, 2019. Liquidity in the call money market has improved as the WACR rate stands eight bps lower than the benchmark rate. The average liquidity in the system was Rs. 1.20 cr during this week. As the Federal Reserve hints a dovish stance, the yield chasing capital would inflow to emerging market including India. Therefore, liquidity situation in India is expected to improve.
Capital Market
On the global capital market front, 10-year US sovereign yield remains stable 2.06% during the last week of July. Federal Reserve has trimmed fed rate by 25 bps during the fifth FOMC meeting on July 31, 2019. This will lead to a fall in the 10-year US sovereign yield. The 10- year Indian sovereign yield, which was on downward trend for past four week has increased by 17 bps over a week to 6.62%. The increase in the yield was result of uncertainty over the external borrowings. However, with fed rate cut and excess liquidity in the money market will lead the 10-year Indian G-Sec to further decline.
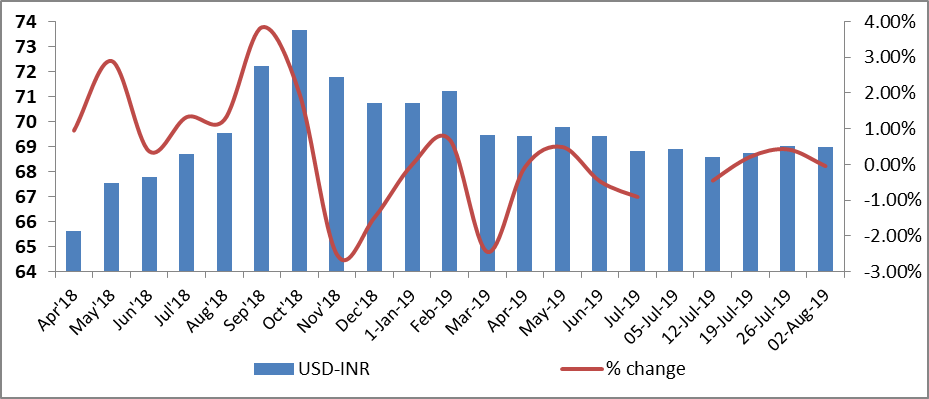
Currency Trend
On a weekly average, USD-INR currency pair stands at 68.99 during the first week of August 2019. However, the currency pair is currently trading at close to 71. The currency market is highly volatile on account of Fed rate cut. In addition, China’s decision to devaluating its currency (yuan) has led to a currency war in the exchange rate market. The emerging economies are expected to retaliate to this move to keep their export competitive.
Interest rates and ratio:
|
Interest Rate |
July.,27 |
June.,28 |
July.,5 |
July.,12 |
July.,19 |
July.,26 |
|
2018 |
2019 |
2019 |
2019 |
2019 |
2019 |
|
|
Policy Repo Rate |
6.25 |
5.75 |
5.75 |
5.75 |
5.75 |
5.75 |
|
Call Money Rate (WA) |
6.21 |
5.78 |
5.67 |
5.62 |
5.61 |
5.59 |
|
364-Day Treasury Bill Yield |
7.27 |
6.16 |
6.13 |
6.06 |
5.98 |
5.98 |
|
2-Yr Indian G-Sec |
7.57 |
6.17 |
6.18 |
6.06 |
6.10 |
6.01 |
|
10-Yr Indian G-Sec |
7.75 |
6.93 |
6.76 |
6.56 |
6.45 |
6.62 |
|
10-Yr US G-Sec |
2.95 |
2.04 |
2.12 |
2.06 |
2.07 |
1.84 |
|
AAA (Indian corporate) |
8.54 |
7.95 |
8.04 |
8.30 |
7.42 |
7.76 |
|
Spread in bps (10Yr Indian-10Yr US) |
480 |
489 |
464 |
450 |
438 |
478 |
|
Credit/Deposit Ratio |
74.93 |
|
76.51 |
|
76.34 |
|
|
USD LIBOR (3 month) |
1.9173 |
2.3549 |
2.3564 |
2.3590 |
2.3606 |
2.3504 |
Acuité Portfolio Debt Instrument Benchmark Estimates (as on 05 August 2019):
|
Category |
10-Yr Corporate Yield to Maturity |
|
AAA* |
NA |
|
AA+ |
7.66% |
|
AA |
8.63% |
|
|
Deposit (In Rs. Lakh cr) |
Bank Credit (In Rs. Lakh cr) |
|
As on July 19, 2019 |
126.49 |
96.57 |
|
As on June 21,2019 |
124.92 |
96.49 |
|
As on July 20,2018 |
114.37 |
86.09 |
|
YTD (% change) |
1.26% |
0.08% |
|
YoY (% change) |
10.60% |
12.17% |
Money Market
Performance
|
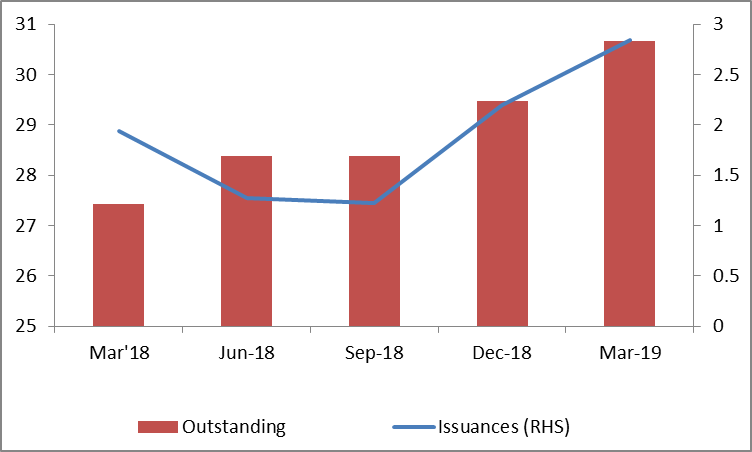
Commercial Paper (Fortnight): |
Outstanding (In Rs. Billion) |
Amount issued (In Rs. Billion) |
|
30-Jun-19 |
5,039.40 |
1076.9 |
|
15-Jun-19 |
5,561.80 |
1078.7 |
|
30-Jun-18 |
4,918.30 |
1267.3 |
|
% Change (MoM) |
-9.39% |
-0.17% |
|
% Change (YoY) |
2.46% |
-15.02% |
Indices
|
|
03-Aug-18 |
12-Jul-19 |
19-Jul-19 |
26-Jul-19 |
02-Aug-19 |
|
NSE Index |
11,360.80 |
11,552.50 |
11,419.25 |
11,284.30 |
10,997.35 |
|
NSE Index Return |
0.73 |
-2.19 |
-1.15 |
-1.18 |
-2.54 |
|
BSE Index |
3,756.16 |
38,736.23 |
38,337.01 |
37,882.79 |
37,118.22 |
|
BSE Index Return |
0.59 |
-1.97 |
-1.03 |
-1.18 |
-2.02 |
Liquidity Operation by RBI
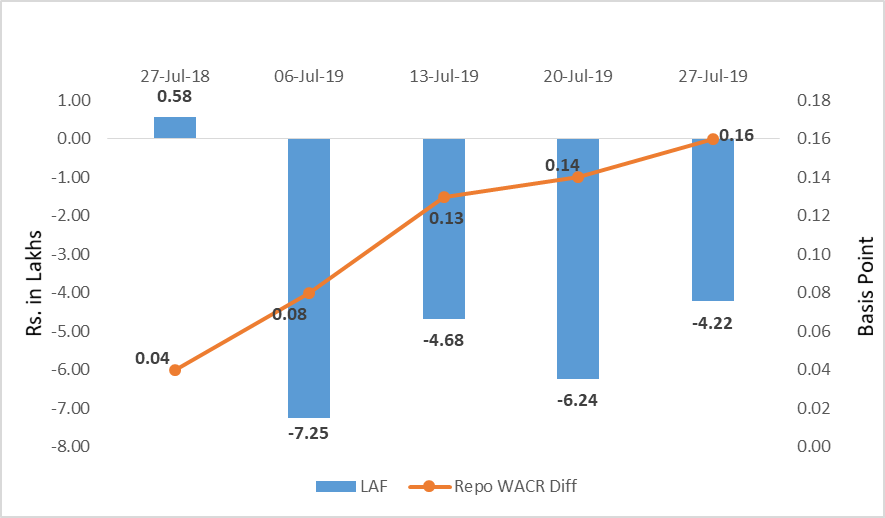
Source: RBI, Acuité Research; Note: Net injection (+) and Net absorption (-)
Corporate debt (in Rs. Lakh Cr)
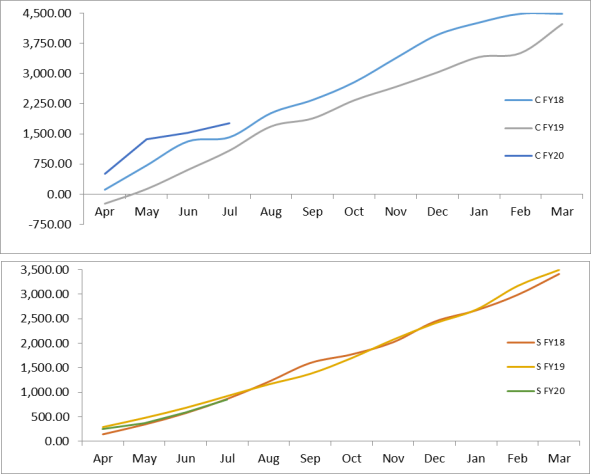
Net Debt Issuance by Centre and State Government (Rs. Billion)
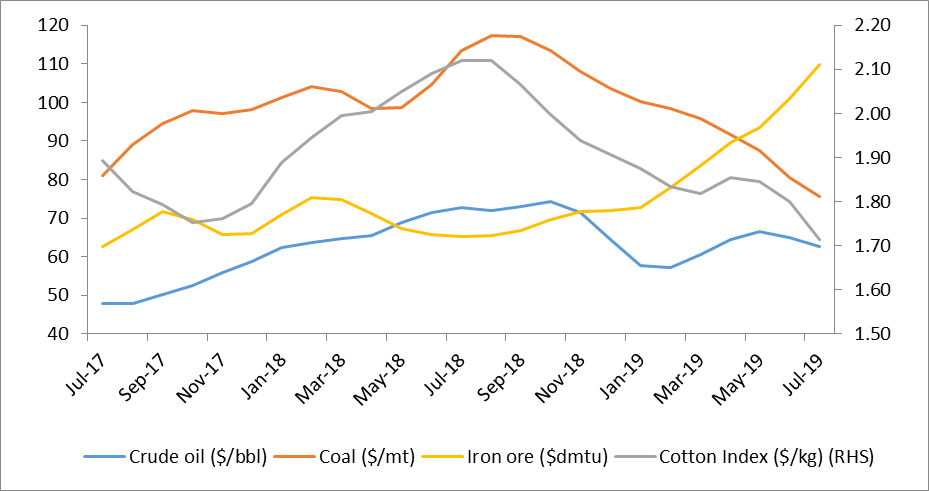
Commodity Price Index (3 Month Moving Average)
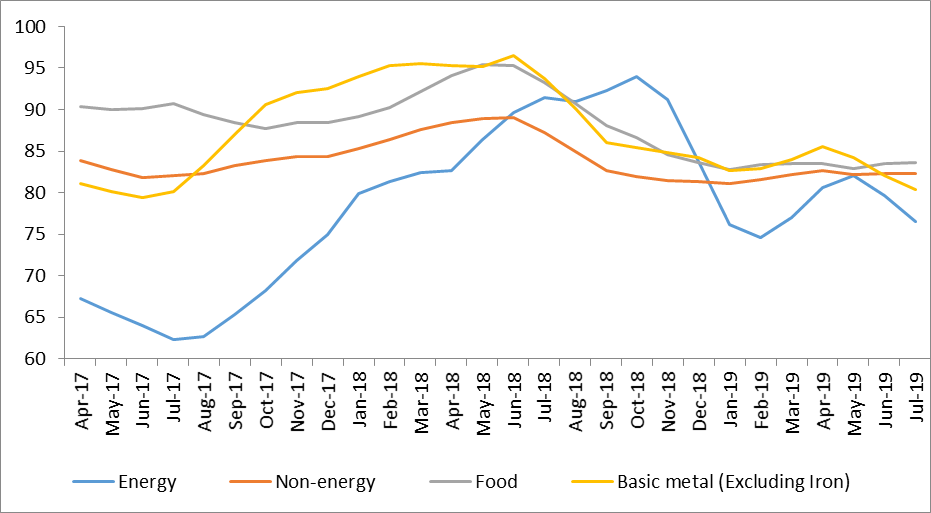
Commodity Price Movement (3 Month Moving Average)
USD-INR Movement
Source: RBI, Acuité Research
 +91 99698 98000
 info@acuite.in
 Follow us
 +91 22 49294000
 DOWNLOAD