Key Highlights:
Liquidity
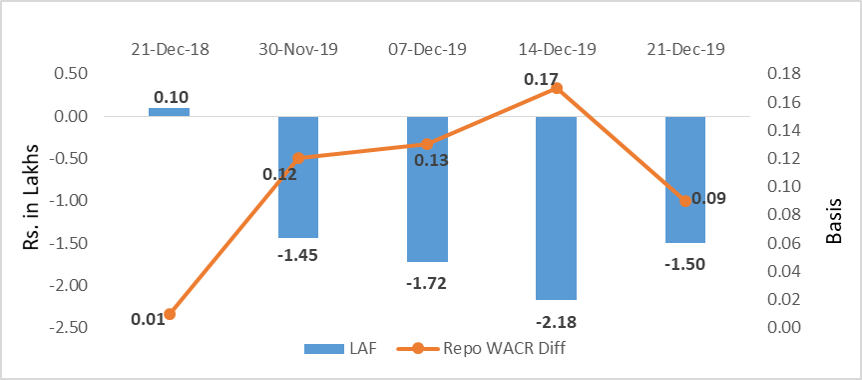
The liquidity in the system has marginally subsided to Rs.1.52 lakh crore during the third week of December 2019. Consequently, the over-night lending rate has increased to 5.06% during the week. It is known that as surplus liquidity in the system breached Rs. 2 lakh crore during the previous week, the call money rate had reduced to 4.98%. We note that RBI had conducted a special OMO of simultaneous buying (long term) and selling (short term) securities worth of Rs. 10,000 and 6,825 crore, respectively on Monday (23rd of December). Under the OMO operations, excess liquidity created amounts to Rs.3,175 crore. We reckon that if the commercial banks intend to shore up their level 1 HQLA, the residual money may be channelled back to the RBI under either the LAF window or a later OMO. The same amount may be adjusted on the liability side of the RBI’s balance sheet as new Currency in Circulation/ Currency Issued. Meanwhile the asset side may adjust through either loans & advances (to the Government) or other assets rising by that quantum.
Capital Market
The 10-year Indian sovereign yield had subsided by 18bps to 6.81% during the third week of December 2019. Currently, the sovereign debt is yielding around 6.5% as RBI has conducted special OMO to cooldown the long term yields. In the global market, the 10-year US sovereign yield is steady at 1.9% as market has remained inactive ahead of year-end holiday.
Currency Trend
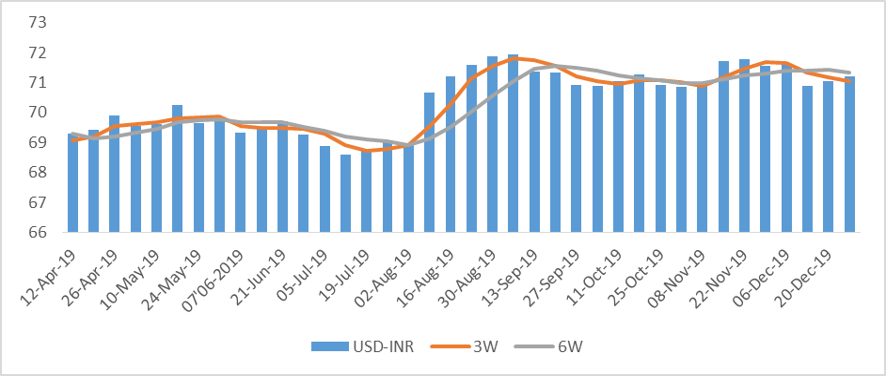
Ahead of the year-end, most of the emerging market’s currencies remain stronger against the USD. However, Indian rupee along with Turkish Lira (TRY) and Hong Kong Dollar (HKD) is among EME currencies that are depreciating in a market, where peers are appreciating. The weaker Indian rupee is a result of the central bank’s intervention and spikes in oil prices. In 2020, Japan government has proposed to increase government expenditure by Yen 4.4 trillion ($40.5 billion) in order to boost private consumption and strengthen the higher value adding sectors. The expansionary budget of Japan government will have significant impact on currency as well as capital markets, including that of India’s. Another positive factor from Indian rupee’s perspective is US’s oil production capacity reaching 13 million bpd. This will help in keeping the global oil prices low – a condition that is advantageous for oil consuming countries such as India and China, in the management of their current account balances.
Interest rates and ratio:
|
Interest Rate |
Dec.,21 |
Nov.,22 |
Nov.,29 |
Dec.,06 |
Dec.,13 |
Dec.,20 |
|
2018 |
2019 |
2019 |
2019 |
2019 |
2019 |
|
|
Policy Repo Rate |
6.50 |
5.15 |
5.15 |
5.15 |
5.15 |
5.15 |
|
Call Money Rate (WA) |
6.49 |
5.05 |
5.03 |
5.02 |
4.98 |
5.06 |
|
364-Day Treasury Bill Yield |
6.97 |
5.17 |
5.14 |
5.10 |
5.25 |
5.27 |
|
2-Yr Indian G-Sec |
7.05 |
5.52 |
5.73 |
5.78 |
5.88 |
5.82 |
|
10-Yr Indian G-Sec |
7.26 |
6.66 |
6.65 |
6.86 |
6.99 |
6.81 |
|
10-Yr US G-Sec |
1.88 |
1.77 |
1.84 |
1.82 |
1.91 |
1.88 |
|
AAA (Indian corporate) |
8.59 |
7.63 |
7.55 |
7.79 |
7.75 |
7.63 |
|
Spread in bps (10Yr Indian- US) |
538 |
489 |
481 |
504 |
509 |
493 |
|
Credit/Deposit Ratio |
78.60 |
76.09 |
- |
75.80 |
- |
- |
|
USD LIBOR (3 month) |
2.3879 |
1.5414 |
1.5396 |
1.5293 |
1.5338 |
1.5340 |
|
Forward Premia of US$ 1-month |
4.45 |
3.26 |
3.35 |
3.53 |
3.65 |
3.88 |
|
US$ 3-month |
3.94 |
3.34 |
3.35 |
3.53 |
3.73 |
3.82 |
|
US$ 6-month |
4.11 |
3.76 |
3.76 |
3.95 |
4.30 |
4.33 |
Source: RBI, Investing.com
|
|
Deposit (In Rs. Lakh cr) |
Bank Credit (In Rs. Lakh cr) |
|
As on Dec 06,2019 |
131.06 |
99.35 |
|
As on Nov 08,2019 |
129.98 |
98.46 |
|
As on Dec 07,2018 |
118.85 |
92.06 |
|
YTD (% change) |
0.83% |
0.90% |
|
YoY (% change) |
10.28% |
7.91% |
Source: RBI
Money Market Performance
|
Commercial Paper (Fortnight): |
Outstanding (In Rs. Billion) |
Amount issued (In Rs. Billion) |
|
30-Jun-19 |
5,039.40 |
1076.9 |
|
15-Jun-19 |
5,561.80 |
1078.7 |
|
30-Jun-18 |
4,918.30 |
1267.3 |
|
% Change (MoM) |
-9.39% |
-0.17% |
|
% Change (YoY) |
2.46% |
-15.02% |
Source: RBI
Indices
|
|
21-Dec-18 |
29-Nov-19 |
06-Dec-19 |
13-Dec-19 |
20-Dec-19 |
|
NSE Index |
10,754.00 |
12,056.05 |
11,921.50 |
12,086.70 |
12,271.80 |
|
NSE Index Return |
-0.48 |
1.19 |
-1.12 |
1.39 |
1.53 |
|
BSE Index |
35,742.07 |
40,793.81 |
40,445.15 |
41,009.71 |
41,681.54 |
|
BSE Index Return |
-0.61 |
1.08 |
-0.85 |
1.40 |
1.64 |
Source: RBI, Acuité Research;
Note: Net injection (+) and Net absorption (-)
Source: RBI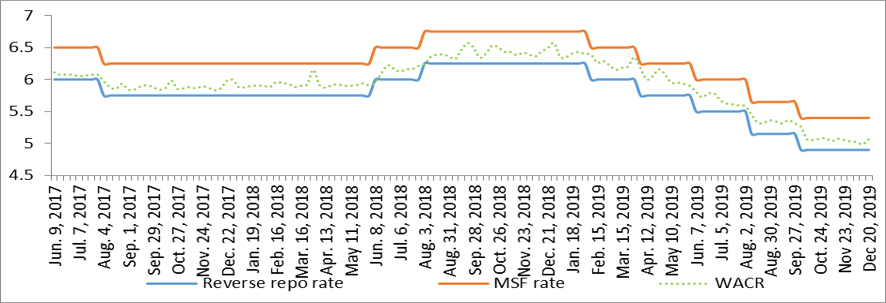
28-1-20.png)
28-1-20.png)
Source: Acuité Research, RBI
28-1-20.png)
28-1-20.png)
Source: RBI, Acuité Research
 +91 99698 98000
 info@acuite.in
 Follow us
 +91 22 49294000
 DOWNLOAD