Key Highlights:
Liquidity
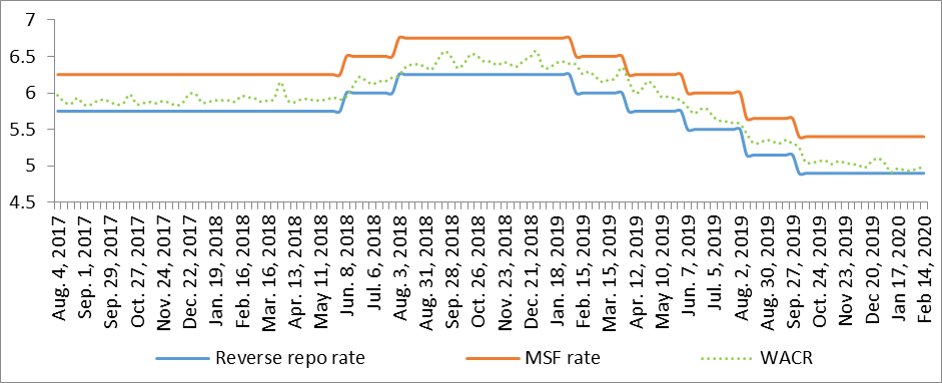
The overall liquidity in the baking system has reduced to Rs.1.59 lakh crore during the second week of February, 2020. Consequently, the call money rate (weighted average) has close to 5%. The over-night lending rate had reduced to 4.94% during the last week of January, 2020 as overall liquidity was close to Rs. 2 lakh crore. Going ahead, due to the persistent economic uncertainty, emerging markets including India would witness higher capital outflow towards safe havens. This is expected to put pressure on domestic liquidity.
Capital Market
On the capital market front, the 10-year Indian sovereign yield in response to the RBI’s LTRO has subsided to 6.62% during the second week of February, 2020. The yield has notched down by almost 25 bps over the past two weeks. In addition to the RBI’s operation, the lower US sovereign yield also a favourable factor here. The 10-year US G-sec has declined by almost 12 bps to 1.47%. The fear of economic slowdown/ possible recession has been further exacerbated by China’s impact (Coronavirus threat) on the global supply chain, given its weight and capacity contribution. The uncertainties will further raise the demand for safe-haven assets as financial vulnerabilities will make investors jittery. Consequently, yields of US sovereign bond are expected to reduce further. Going ahead, India’s Q3 GDP number due on Feb 28, will be a major event for the capital as well as for currency market participants. However, with no major improvement in leading indicators, we expect the GDP growth to remain steady at 4.8% for Q3 FY2020 - unlikely setting the market tone.
Currency Trend
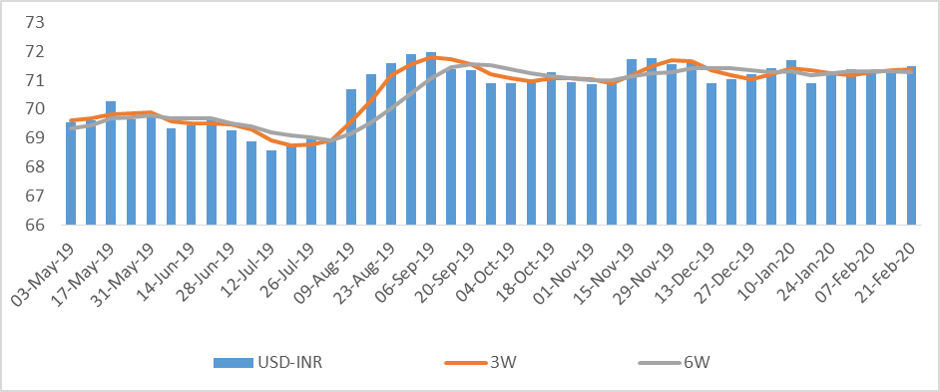
Turning to currency market, higher capital outflows keep the Indian rupee to be underperformer against the US dollar. The volatility in currency market is attributed to higher capital outflows from EMEs and disruption in global trade amid of coronavirus. Among the major currencies, on the back of the weak domestic economic outlook in Japan and the UK, the yen and pound has ceded ground to the US dollar, respectively. At the same time, with the poor Q4 GDP print in Germany, the euro also seems less attractive. Therefore, the US dollar remains the sole safe-assets currency at the moment.
Interest rates and ratio:
|
Interest Rate |
Feb.,15 |
Jan.,17 |
Jan.,24 |
Jan.,31 |
Feb.,07 |
Feb.,14 |
|
2019 |
2020 |
2020 |
2020 |
2020 |
2020 |
|
|
Policy Repo Rate |
6.25 |
5.15 |
5.15 |
5.15 |
5.15 |
5.15 |
|
Call Money Rate (WA) |
6.26 |
4.97 |
4.95 |
4.94 |
4.97 |
4.99 |
|
364-Day Treasury Bill Yield |
6.51 |
5.30 |
5.29 |
5.29 |
5.32 |
5.24 |
|
2-Yr Indian G-Sec |
6.71 |
5.70 |
5.67 |
5.61 |
5.56 |
5.53 |
|
10-Yr Indian G-Sec |
7.58 |
6.86 |
6.82 |
6.86 |
6.70 |
6.62 |
|
10-Yr US G-Sec |
2.65 |
1.69 |
1.51 |
1.58 |
1.59 |
1.47 |
|
AAA (Indian corporate) |
8.53 |
7.83 |
7.48 |
7.63 |
7.54 |
7.23 |
|
Spread in bps (10Yr Indian- US) |
493 |
517 |
532 |
528 |
511 |
515 |
|
Credit/Deposit Ratio |
77.89 |
76.21 |
- |
75.82 |
- |
- |
|
USD LIBOR (3 month) |
2.3828 |
1.5311 |
1.5318 |
1.5688 |
1.5720 |
1.5761 |
|
Forward Premia of US$ 1-month |
4.21 |
4.05 |
3.79 |
3.52 |
3.20 |
3.19 |
|
US$ 3-month |
4.32 |
4.16 |
4.15 |
4.25 |
3.82 |
3.64 |
|
US$ 6-month |
4.18 |
4.22 |
4.13 |
4.21 |
3.85 |
3.68 |
Source: RBI, Investing.com
|
|
Deposit (In Rs. Lakh cr) |
Bank Credit (In Rs. Lakh cr) |
|
As on Jan 31,2020 |
133.24 |
101.03 |
|
As on Jan 03,2020 |
132.10 |
100.36 |
|
As on Feb 01,2019 |
121.23 |
94.30 |
|
YTD (% change) |
0.86% |
0.66% |
|
YoY (% change) |
9.91% |
7.14% |
Source: RBI
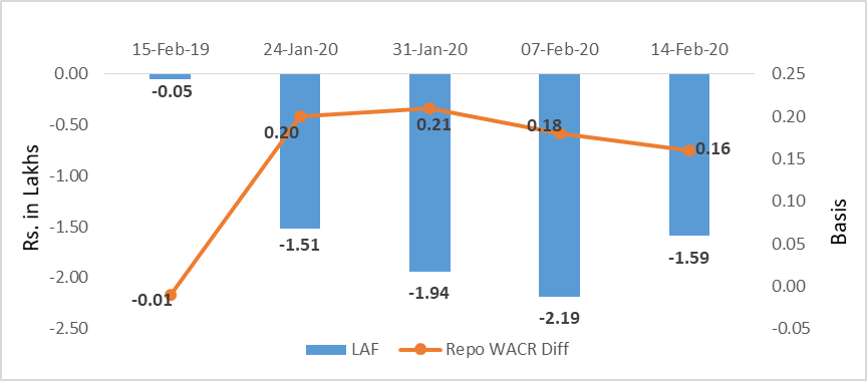
Source: RBI, Acuité Research;
Note: Net injection (+) and Net absorption (-)
-3-26-2.png)
-3-26-2.png)
Source:
Acuité Research, RBI
-3-26-2.png)
-3-26-2.png)
Source:
RBI, Acuité Research
 +91 99698 98000
 info@acuite.in
 Follow us
 +91 22 49294000
 DOWNLOAD