Key Highlights:
Liquidity
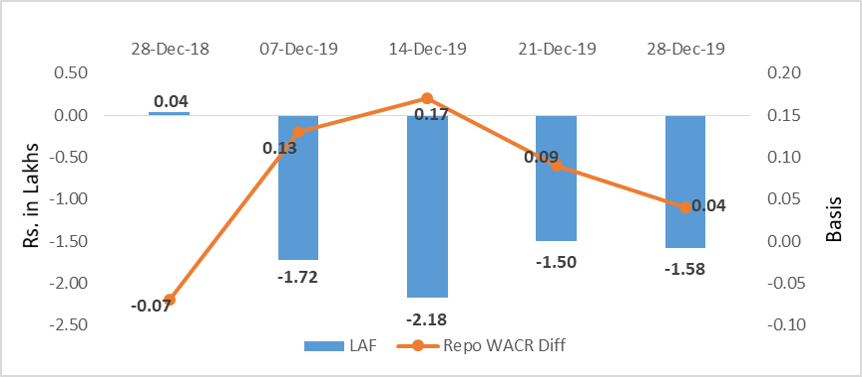
The liquidity in the banking system stands at Rs. 1.58 lakh crore as on last week of December 2019. The call money rate has increased to 5.11%. As a result, spread between repo and call money rate has come down to four bps. The lower spread is result of RBI’s two simultaneous OMO operations during the preceding week that are stoking short term yields and eventually WACR. Under the first operation, the central bank has sold Rs. 6,825 crore short-term liquidity in the system and infused Rs. 10,000 crore worth of liquidity by purchasing longer term debt. In the second operation, another round of simultaneous purchase and sale of short term for long term securities worth Rs. 10,000 crore was undertake. As RBI is likely to conduct series of such operation ahead of the year-end of FY20, the yield curve is likely to flatten further.
Capital Market
The 10-year Indian sovereign yield has subsided to 6.74% during the third last week of December 2019. As mentioned earlier, in order to cooldown the long-term yield, the RBI has conducted two special OMO operations in last two consecutive weeks. Therefore, yield is expected to subside further. It is known that overall fiscal deficit has breached Rs. 8 lakh crore mark in FY20 as on November despite a surplus transfer of Rs. one lakh crore from the RBI. The figure was Rs. 7lakh crore during the same period, the previous year. Therefore, higher borrowing has been pushing the yield.
Currency Trend
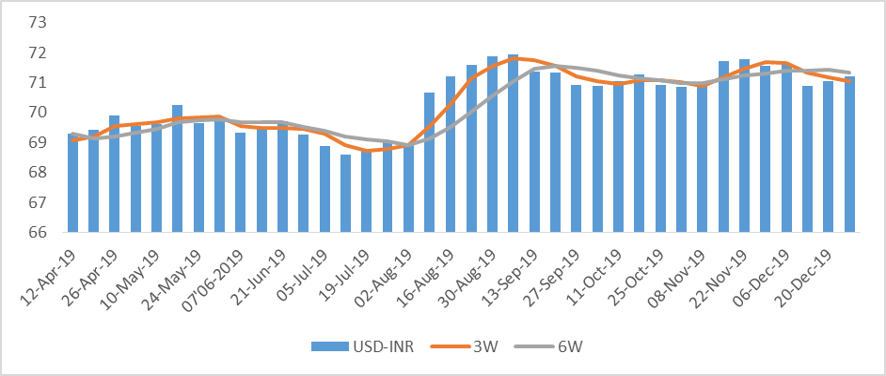
Coming to the currency market, Indian rupee has continued to remain weak for past three weeks. In the global commodity market, oil price has sharply increased in response to the US-Iran tension. A higher oil price will consequently dent India’s trade balance. Currency traders being fearful of increases in trade deficit have been selling Indian rupee. This has been further weakening the domestic currency. In recent weeks, Indian rupee has been underperforming as compared to its emerging market rivals. When improvement in US-China trade deal was creating a positive sentiment in the market, the crisis in the middle-east has acted as an offset to the upside. Overall, in the currency market, the US dollar was initially seen weakening as trading resumed for the CY2020 due to capital flight to higher yield destinations. However, the currency has been strengthening amidst ongoing geo-political tension primarily driven by a safe haven demand.
Interest rates and ratio:
|
Interest Rate |
Dec.,28 |
Nov.,29 |
Dec.,06 |
Dec.,13 |
Dec.,20 |
Dec.,27 |
|
2018 |
2019 |
2019 |
2019 |
2019 |
2019 |
|
|
Policy Repo Rate |
6.50 |
5.15 |
5.15 |
5.15 |
5.15 |
5.15 |
|
Call Money Rate (WA) |
6.57 |
5.03 |
5.02 |
4.98 |
5.06 |
5.11 |
|
364-Day Treasury Bill Yield |
6.94 |
5.14 |
5.10 |
5.25 |
5.27 |
5.30 |
|
2-Yr Indian G-Sec |
7.04 |
5.73 |
5.78 |
5.88 |
5.82 |
5.76 |
|
10-Yr Indian G-Sec |
7.41 |
6.65 |
6.86 |
6.99 |
6.81 |
6.74 |
|
10-Yr US G-Sec |
2.67 |
1.84 |
1.82 |
1.91 |
1.88 |
1.79 |
|
AAA (Indian corporate) |
8.43 |
7.55 |
7.79 |
7.75 |
7.63 |
7.56 |
|
Spread in bps (10Yr Indian- US) |
474 |
481 |
504 |
509 |
493 |
495 |
|
Credit/Deposit Ratio |
78.59 |
- |
75.80 |
- |
76.47 |
- |
|
USD LIBOR (3 month) |
2.3910 |
1.5396 |
1.5293 |
1.5338 |
1.5340 |
1.5331 |
|
Forward Premia of US$ 1-month |
4.37 |
3.35 |
3.53 |
3.65 |
3.88 |
3.96 |
|
US$ 3-month |
3.97 |
3.35 |
3.53 |
3.73 |
3.82 |
3.90 |
|
US$ 6-month |
4.09 |
3.76 |
3.95 |
4.30 |
4.33 |
4.38 |
Source: RBI, Investing.com
|
|
Deposit (In Rs. Lakh cr) |
Bank Credit (In Rs. Lakh cr) |
|
As on Dec 20,2019 |
130.09 |
99.47 |
|
As on Nov 22,2019 |
129.59 |
98.61 |
|
As on Dec 07,2018 |
118.85 |
92.06 |
|
YTD (% change) |
0.39% |
0.88% |
|
YoY (% change) |
9.46% |
8.05% |
Money Market Performance
|
Commercial Paper (Fortnight): |
Outstanding (In Rs. Billion) |
Amount issued (In Rs. Billion) |
|
30-Jun-19 |
5,039.40 |
1076.9 |
|
15-Jun-19 |
5,561.80 |
1078.7 |
|
30-Jun-18 |
4,918.30 |
1267.3 |
|
% Change (MoM) |
-9.39% |
-0.17% |
|
% Change (YoY) |
2.46% |
-15.02% |
Indices
|
|
28-Dec-18 |
06-Dec-19 |
13-Dec-19 |
20-Dec-19 |
27-Dec-19 |
|
NSE Index |
10,859.90 |
11,921.50 |
12,086.70 |
12,271.80 |
12,245.80 |
|
NSE Index Return |
0.98 |
-1.12 |
1.39 |
1.53 |
-0.21 |
|
BSE Index |
36,076.72 |
40,445.15 |
41,009.71 |
41,681.54 |
41,575.14 |
|
BSE Index Return |
0.94 |
-0.85 |
1.40 |
1.64 |
-0.26 |
Source: RBI, Acuité Research;
Note: Net injection (+) and Net absorption (-)
Source: RBI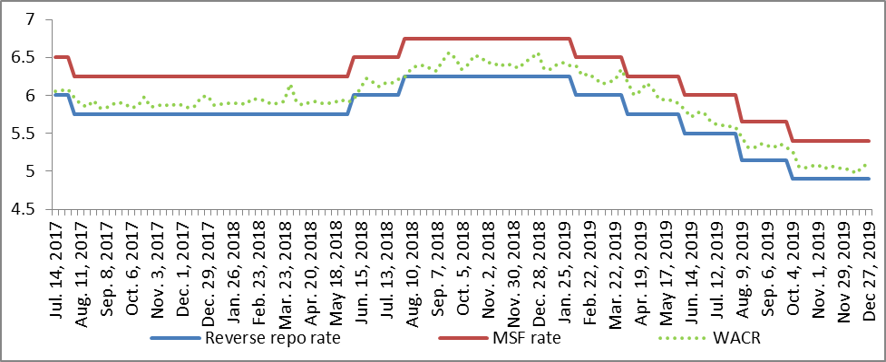
jan-6-20.png)
jan-6-20.png)
Source: Acuité Research, RBI
jan-6-20.png)
jan-6-20.png)
Source:
RBI, Acuité Research
 +91 99698 98000
 info@acuite.in
 Follow us
 +91 22 49294000
 DOWNLOAD