Key Highlights:
Liquidity
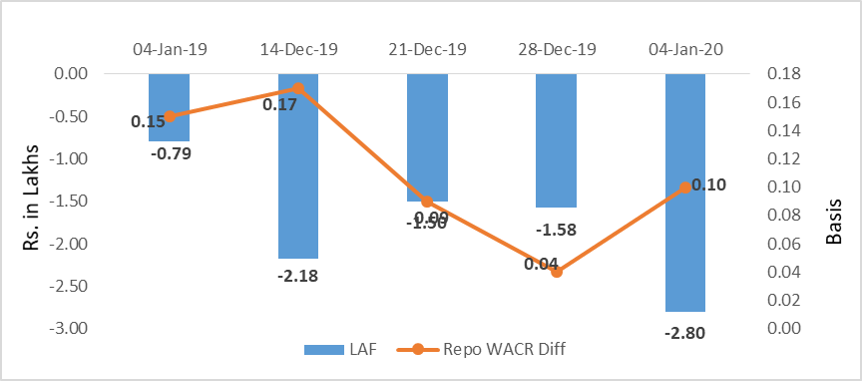
The weighted average call money rate reduced to 5.05% during the first week of January 2020, which was 5.11% a week earlier. As a result, the spread between repo and the call money rate increased to 10bps. Liquidity in the system has further ballooned to Rs.2.8 lakh crore during the week. This excess liquidity in the system is attributed to increase in forex reserves. During the week, India’s forex reserve has increased by $3.7 billion, reaching a record $461.1 billion. With continued foreign capital inflows along with deposit rate outstripping offtake, systemic liquidity in the domestic market has surpassed recent peaks. Risk averse commercial banks are also unable to deploy the surplus cash, which may in turn channelled to treasury.
Capital Market
In the capital market, the 10-year Indian sovereign yield has been range bound at 6.73% during the week. The long term yield has remained somewhat consistent after the central bank’s two special OMOs of simultaneous buying and selling of long-short government securities. At the same time, government issuances have also declined sharply as fiscal deficit exceeded Rs.8 lakh crore in the first nine month of the current fiscal year. In December 2019, consumer inflation reached a five year high of 7.35% with accompanying momentary spikes in yields. A sharp acceleration in consumer inflation will be a new challenge for the central bank while controlling yields as monetarily nothing much can be done to aid a slowing economy at this point. On the global market front, 10-year US sovereign yields were found to go uphill on the back of lower safe haven demand, especially after US and China are reportedly moving closer to signing the first phase of a trade deal. At the same time, the US-Iran tension that earlier sparked the oil price rally has recently started fading.
Currency Trend
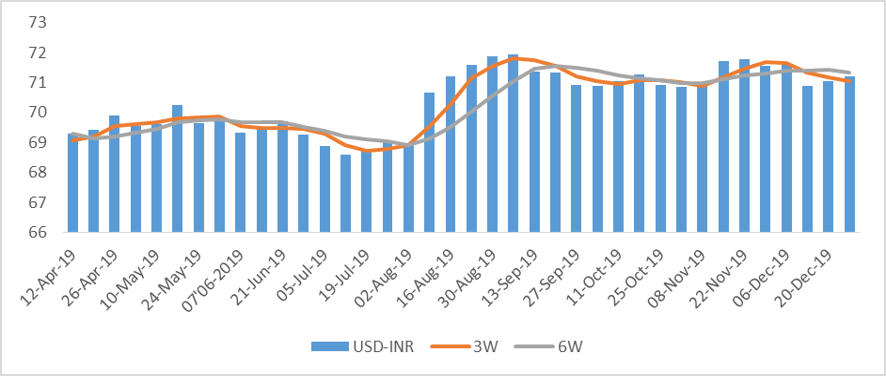
Coming to the currency market, INR continues to weaken against the USD since five weeks now and has reached 71.68 during the second week of January 2020. While the current geo-political development (after the US-Iran tension) is unfavourable for the INR, RBI’s market interventions are further depreciating the currency. The central bank’s USD accumulations have been put to good use in making the currency competitive in a bid to incentivizing exporters. Foreign capital however continues to flow from DMs, compensating this downfall. The foreign money in turn is driven by the start of a quantitative easing of sorts in the US, Japan and the EU. Furthermore, in order to give a momentum to the country’s economic growth, the Bank of England is most likely to cut policy rate during its MPC meeting on January 30, 2020. This will be the first rate cut by the British central bank in seven years. We reckon that this event will further add to the global liquidity and ultimately capital inflows.
Interest rates and ratio:
|
Interest Rate |
Jan.,04 |
Dec.,06 |
Dec.,13 |
Dec.,20 |
Dec.,27 |
Jan.,03 |
|
2019 |
2019 |
2019 |
2019 |
2019 |
2020 |
|
|
Policy Repo Rate |
6.50 |
5.15 |
5.15 |
5.15 |
5.15 |
5.15 |
|
Call Money Rate (WA) |
6.35 |
5.02 |
4.98 |
5.06 |
5.11 |
5.05 |
|
364-Day Treasury Bill Yield |
6.91 |
5.10 |
5.25 |
5.27 |
5.30 |
5.30 |
|
2-Yr Indian G-Sec |
7.00 |
5.78 |
5.88 |
5.82 |
5.76 |
5.69 |
|
10-Yr Indian G-Sec |
7.45 |
6.86 |
6.99 |
6.81 |
6.74 |
6.73 |
|
10-Yr US G-Sec |
2.70 |
1.82 |
1.91 |
1.88 |
1.79 |
1.82 |
|
AAA (Indian corporate) |
8.66 |
7.79 |
7.75 |
7.63 |
7.56 |
7.60 |
|
Spread in bps (10Yr Indian- US) |
475 |
504 |
509 |
493 |
495 |
491 |
|
Credit/Deposit Ratio |
77.59 |
75.80 |
- |
76.47 |
- |
- |
|
USD LIBOR (3 month) |
2.3919 |
1.5293 |
1.5338 |
1.5340 |
1.5331 |
1.5405 |
|
Forward Premia of US$ 1-month |
4.12 |
3.53 |
3.65 |
3.88 |
3.96 |
3.68 |
|
US$ 3-month |
4.06 |
3.53 |
3.73 |
3.82 |
3.90 |
3.93 |
|
US$ 6-month |
4.09 |
3.95 |
4.30 |
4.33 |
4.38 |
4.27 |
Source: RBI, Investing.com
|
|
Deposit (In Rs. Lakh cr) |
Bank Credit (In Rs. Lakh cr) |
|
As on Dec 20,2019 |
130.09 |
99.47 |
|
As on Nov 22,2019 |
129.59 |
98.61 |
|
As on Dec 07,2018 |
118.85 |
92.06 |
|
YTD (% change) |
0.39% |
0.88% |
|
YoY (% change) |
9.46% |
8.05% |
Money Market Performance
|
Commercial Paper (Fortnight): |
Outstanding (In Rs. Billion) |
Amount issued (In Rs. Billion) |
|
30-Jun-19 |
5,039.40 |
1076.9 |
|
15-Jun-19 |
5,561.80 |
1078.7 |
|
30-Jun-18 |
4,918.30 |
1267.3 |
|
% Change (MoM) |
-9.39% |
-0.17% |
|
% Change (YoY) |
2.46% |
-15.02% |
Indices
|
|
04-Jan-19 |
13-Dec-19 |
20-Dec-19 |
27-Dec-19 |
03-Jan-20 |
|
NSE Index |
10,727.35 |
12,086.70 |
12,271.80 |
12,245.80 |
12,226.65 |
|
NSE Index Return |
-1.22 |
1.39 |
1.53 |
-0.21 |
-0.16 |
|
BSE Index |
35,695.10 |
41,009.71 |
41,681.54 |
41,575.14 |
41,464.61 |
|
BSE Index Return |
-1.06 |
1.40 |
1.64 |
-0.26 |
-0.27 |
Source: RBI, Acuité Research;
Note: Net injection (+) and Net absorption (-)
Source: RBI
jan-13-20.png)
jan-13-20.png)
Source: Acuité Research, RBI
jan-13-20.png)
jan-13-20.png)
Source:
RBI, Acuité Research
 +91 99698 98000
 info@acuite.in
 Follow us
 +91 22 49294000
 DOWNLOAD