Key Highlights:
Liquidity
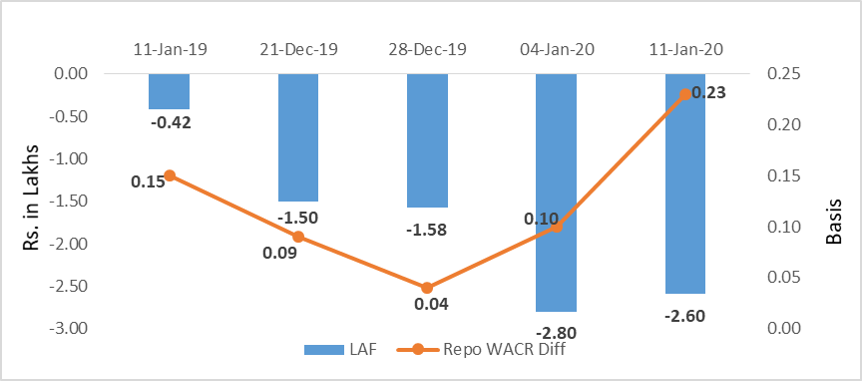
The average weekly liquidity in the system has marginally subsided to Rs.2.6 lakh crore during the second week of January 2020. The liquidity had reached a record high level of Rs.2.8 lakh crore the previous week. Due to weak trading recorded in the call money market, the WACR has consequently reduced to 4.92%, which is 23bps lower than the repo rate. We note that the call money rate is touching lower band of the policy corridor – not indicating a rate cut at this time. Ideally, the incremental credit to deposit ratio remains above 100 during the end of the financial year (between Dec-Mar). However, the ratio has not exceeded 50 so far this year. The weak credit offtake has been therefore elevating the liquidity in the system.
Capital Market
In the domestic capital market, the 10-yr Indian sovereign yield has been range bound for the last three weeks. The central government’s debt issuances have also reduced substantially as shown in the graph below. Furthermore, RBI’s special OMO also helped in cooling the long term yields. We believe that yield is expected to remain steady till the budget (for FY21) announcements placed on Feb 01, 2020. In the global market, the US-China trade deal manages to reinforce the positive sentiment in the market and the 10-yr US G-sec remain steady at 1.83% for past three weeks. The PBoC has infused around $43.5 billion (Yuan 300 billion) last week in order to ensure sufficient short-medium term loan availability ahead of Chinese new-year (25th Jan). We expect this accommodative stance to push the yield down to 3% (China10-yr yield).
Currency Trend
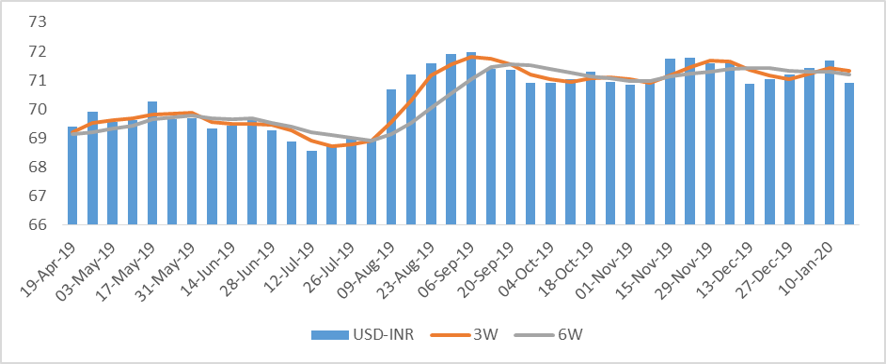
Talking about the currency market, at 70.91 against USD, the INR has appreciated to almost two month high. It is known that the Indian rupee has been weakening against the USD for past four weeks as the currency was under selling pressure emanating from hostile global and domestic factors. Asian currencies are cheering the signing of US-China trade deal. The Federal Reserve on its part has infused $52.6 billion of short term liquidity in the system last week on the back of lower than expected inflation print. As a result, supply of USD in the system has increased. Another development in the currency market is the safe heaven demand for the British pound, which is appreciating after restored political stability in the country. Therefore, on a medium term horizon, some major currencies (excluding USD and JPY) are expected to vacate space for the sterling, in our view.
Interest rates and ratio:
|
Interest Rate |
Jan 11 |
Dec 13 |
Dec 20 |
Dec 27 |
Jan 03 |
Jan 10 |
|
2019 |
2019 |
2019 |
2019 |
2020 |
2020 |
|
|
Policy Repo Rate |
6.50 |
5.15 |
5.15 |
5.15 |
5.15 |
5.15 |
|
Call Money Rate (WA) |
6.35 |
4.98 |
5.06 |
5.11 |
5.05 |
4.92 |
|
364-Day Treasury Bill Yield |
6.88 |
5.25 |
5.27 |
5.30 |
5.30 |
5.29 |
|
2-Yr Indian G-Sec |
7.03 |
5.88 |
5.82 |
5.76 |
5.69 |
5.75 |
|
10-Yr Indian G-Sec |
7.27 |
6.99 |
6.81 |
6.74 |
6.73 |
6.84 |
|
10-Yr US G-Sec |
2.79 |
1.91 |
1.88 |
1.79 |
1.82 |
1.83 |
|
AAA (Indian corporate) |
8.47 |
7.75 |
7.63 |
7.56 |
7.60 |
7.64 |
|
Spread in bps (10Yr Indian- US) |
448 |
509 |
493 |
495 |
491 |
502 |
|
Credit/Deposit Ratio |
77.60 |
- |
76.47 |
- |
76.04 |
- |
|
USD LIBOR (3 month) |
2.3941 |
1.5338 |
1.5340 |
1.5331 |
1.5405 |
1.5270 |
|
Forward Premia of US$ 1-month |
4.09 |
3.65 |
3.88 |
3.96 |
3.68 |
3.71 |
|
US$ 3-month |
4.06 |
3.73 |
3.82 |
3.90 |
3.93 |
4.11 |
|
US$ 6-month |
4.06 |
4.30 |
4.33 |
4.38 |
4.27 |
4.20 |
|
|
Deposit (In Rs. Lakh cr) |
Bank Credit (In Rs. Lakh cr) |
|
As on Jan 03,2020 |
132.10 |
100.45 |
|
As on Dec 06,2019 |
131.06 |
99.35 |
|
As on Dec 21,2018 |
120.34 |
93.38 |
|
YTD (% change) |
0.79% |
1.11% |
|
YoY (% change) |
9.80% |
7.6% |
Source: RBI
Money Market Performance
|
Commercial Paper (Fortnight): |
Outstanding (In Rs. Billion) |
Amount issued (In Rs. Billion) |
|
30-Jun-19 |
5,039.40 |
1076.9 |
|
15-Jun-19 |
5,561.80 |
1078.7 |
|
30-Jun-18 |
4,918.30 |
1267.3 |
|
% Change (MoM) |
-9.39% |
-0.17% |
|
% Change (YoY) |
2.46% |
-15.02% |
Indices
|
|
11-Jan-19 |
20-Dec-19 |
27-Dec-19 |
03-Jan-20 |
10-Jan-20 |
|
NSE Index |
10,794.95 |
12,271.80 |
12,245.80 |
12,226.65 |
12,256.80 |
|
NSE Index Return |
0.63 |
1.53 |
-0.21 |
-0.16 |
0.25 |
|
BSE Index |
36,009.84 |
41,681.54 |
41,575.14 |
41,464.61 |
41,599.72 |
|
BSE Index Return |
0.88 |
1.64 |
-0.26 |
-0.27 |
0.33 |
Source: RBI, Acuité Research;
Note: Net injection (+) and Net absorption (-)
Source: RBI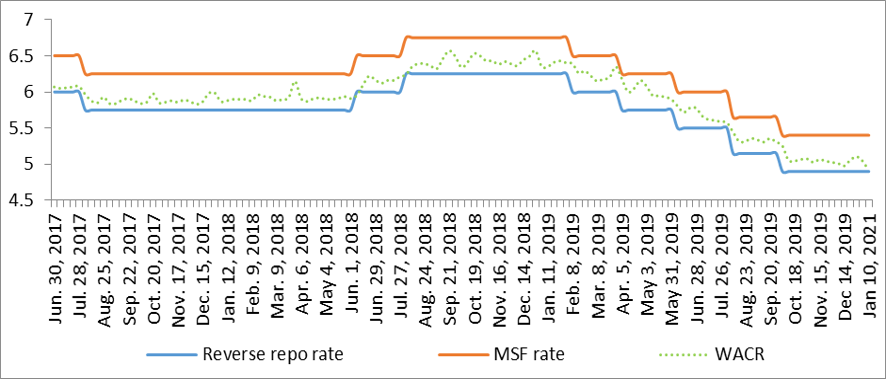
20-20.png)
20-20.png)
Source: Acuité Research, RBI
20-20.png)
20-20.png)
Source:
RBI, Acuité Research
 +91 99698 98000
 info@acuite.in
 Follow us
 +91 22 49294000
 DOWNLOAD