Key Highlights:
Liquidity
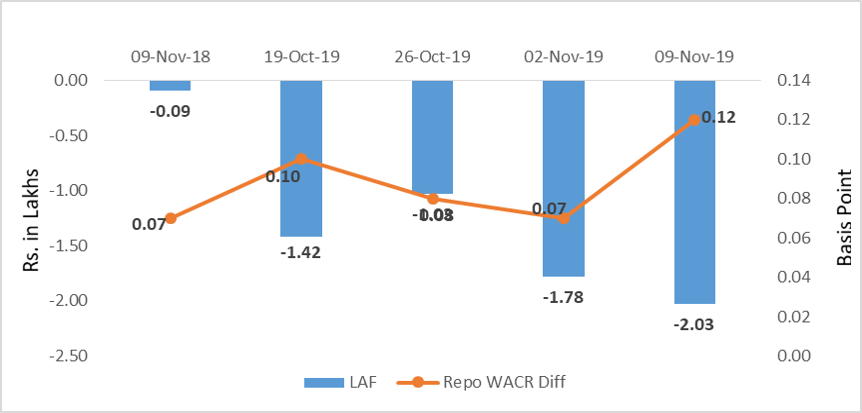
The WACR-repo spread reduced to 12 bps as the liquidity in the system further increased. The overall liquidity in the system exceeded Rs. 2 lakh crore during the first week of November 2019. The surplus liquidity is a result of higher inflow of cheap money (inflow as a result of lower interest rate abroad), which is in turn a function of rising primary liquidity in the global system. We note that in the current situation, the RBI has been using reverse Repo operations to absorb excess liquidity from the system rather than though OMOs. This is primarily happening because of RBI’s focused approach to supply adequate collaterals to commercial banks, which can then use them at the LAF window at times of need. OMO operations on the other hand would have included non-bank institutions, which often times exhaust their quotas and cannot go beyond a threshold anyway.
Capital Market
On the domestic capital market front, during the first month of the second half, 10 year GSec yields has reduced by only 18 bps. On the other hand, short-term maturity bond yields (90 days and 364 days T-bills) have reduced by 36 bps during the same period. On the global market front, US 10-year sovereign yield has been softening as there is no progress in US-China trade deal. The yield had reached 1.95% as a no progress in trade deal hints no early recovery in economic outlook and therefore calls for a dovish Fed outlook.
Currency Trend
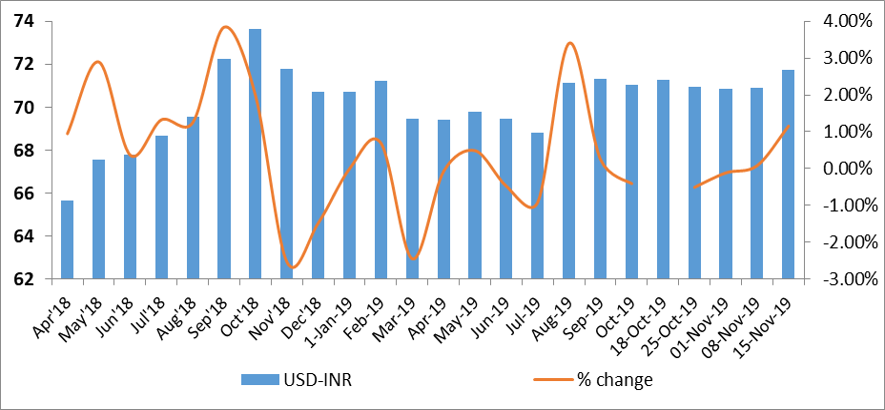
The USD-INR currency pair remained below 71 for a month, eventually reaching 2-month high of 71.73 during the second week of November 2019. The sharp contraction of almost 1.16% over a week was the market’s reaction to Moody’s revised rating outlook for India. Ideally, emerging economy currencies follow movement of USD-CNY currency pair. As the EMs currencies are strengthening against the USD, Indian rupee is expected to recover soon. There is a renewed interest of foreign investors in Indian asset classes lately, forex reserve have accelerated for the past two months and has reached $447.8 billion. Furthermore, the resolution of Essar steel case in Supreme Court will encourage foreign investment and will have a positive impact on the Indian rupee.
Interest rates and ratio:
|
Interest Rate |
Nov 09 |
Oct 11 |
Oct 18 |
Oct 25 |
Nov 01 |
Nov 08 |
|
2018 |
2019 |
2019 |
2019 |
2019 |
2019 |
|
|
Policy Repo Rate |
6.50 |
5.15 |
5.15 |
5.15 |
5.15 |
5.15 |
|
Call Money Rate (WA) |
6.43 |
5.06 |
5.05 |
5.07 |
5.08 |
5.03 |
|
364-Day Treasury Bill Yield |
7.42 |
5.41 |
5.37 |
5.32 |
5.30 |
5.24 |
|
2-Yr Indian G-Sec |
7.42 |
5.67 |
5.64 |
5.62 |
5.67 |
5.60 |
|
10-Yr Indian G-Sec |
7.81 |
6.54 |
6.57 |
6.58 |
6.54 |
6.67 |
|
10-Yr US G-Sec |
3.07 |
1.75 |
1.80 |
1.71 |
1.95 |
1.84 |
|
AAA (Indian corporate) |
8.86 |
7.72 |
7.61 |
7.97 |
7.65 |
7.53 |
|
Spread in bps (10Yr Indian- US) |
475 |
479 |
477 |
487 |
460 |
483 |
|
Credit/Deposit Ratio |
77.05 |
75.66 |
- |
75.81 |
- |
- |
|
USD LIBOR (3 month) |
2.1730 |
1.7926 |
1.8381 |
1.8028 |
1.5921 |
1.5509 |
|
Forward Premia of US$ 1-month |
4.12 |
3.72 |
3.79 |
3.38 |
3.39 |
3.03 |
|
US$ 3-month |
4.01 |
3.80 |
3.71 |
3.61 |
3.70 |
3.42 |
|
US$ 6-month |
4.07 |
4.08 |
4.05 |
3.99 |
4.13 |
3.93 |
|
|
Deposit (In Rs. Lakh cr) |
Bank Credit (In Rs. Lakh cr) |
|
As on Oct 25,2019 |
129.78 |
98.39 |
|
As on Sep 27,2019 |
129.06 |
97.67 |
|
As on Oct 26,2018 |
117.71 |
90.34 |
|
YTD (% change) |
0.56% |
0.73% |
|
YoY (% change) |
10.25% |
8.91% |
Money Market Performance
|
Commercial Paper (Fortnight): |
Outstanding (In Rs. Billion) |
Amount issued (In Rs. Billion) |
|
30-Jun-19 |
5,039.40 |
1076.9 |
|
15-Jun-19 |
5,561.80 |
1078.7 |
|
30-Jun-18 |
4,918.30 |
1267.3 |
|
% Change (MoM) |
-9.39% |
-0.17% |
|
% Change (YoY) |
2.46% |
-15.02% |
Indices
|
|
09-Nov-18 |
18-Oct-19 |
25-Oct-19 |
01-Nov-19 |
08-Nov-19 |
|
NSE Index |
10,585.20 |
11,661.85 |
11,583.90 |
11,890.60 |
11,908.15 |
|
NSE Index Return |
0.31 |
3.16 |
-0.67 |
2.65 |
0.15 |
|
BSE Index |
35,158.55 |
39,298.38 |
39,058.06 |
40,165.03 |
40,323.61 |
|
BSE Index Return |
0.42 |
3.07 |
-0.61 |
2.83 |
0.39 |
Source: RBI, Acuité Research;
Note: Net injection (+) and Net absorption (-)
Source: RBI
Source: Acuité Research, RBI
Source: RBI, Acuité Research
 +91 99698 98000
 info@acuite.in
 Follow us
 +91 22 49294000
 DOWNLOAD