Non-food credit offtake recorded positive growth of 1.0% in September, 2017 – first time in FY18. The improvement comes as a relief, given the fact that these numbers precede capex as well as consumption cycles. Contributing factors include the credit-deposit ratio, which has improved from 72.6% in August, 2017 to 73% September, 2017. Investment-deposit ratio, on the other hand, marginally dropped from 31.0% to 30.4% during the same period. This was primarily due to the excess systemic liquidity by way of demonetisation, when M1 returned to the system. This was excessive in Q4 FY17 but has normalized over time. A rising credit-deposit ratio on the other hand augers the return of positive sentiment and an improvement in business activities.
Sluggish GDP growth in Q1, FY18 also reflects a weak momentum in business activities in India, again, mainly because of demonetisation and the implementation of GST. With excess capacity in the system, industrial capex has failed to build momentum. A case in point are the previous year’s macro numbers; while the Indian economy expanded by 7.1%, Gross Capital Formation (GCF) recorded a weak growth rate of 0.5% in FY17. Overall term loan growth has also dropped to (-) 9% last financial.
At this time, the growth rate in GVA is primarily driven by private consumption and government expenditure. In the current context though, we are with the understanding that these variables can drive the economy to an extent. Consumption must go hand in hand with gross fixed capital investment, emanating from the private sector. We therefore believe that capital formation should expand in line with the GVA in order to maintain a sustainable growth.
On a positive note, the recent IIP numbers auger a recovery of sorts. Recent trend in capital goods category signals a capacity expansion in the economy. Capital goods, which have been reeling under a negative growth for the past eleven months has rebounded with a solid growth of 5.4% in August and 7.4% in September.
Following closely, the sub-category offtake assessment indicates an improvement in the industry and services credit. Despite the fact that the primarily growth continues to come from retail loans, productive sectors showed improvements as well. Cumulative credit offtake in service sector has improved from (-) 9.5% in July, 2017 to (-) 1.5% in September, 2017. Industry offtake also marginally improved to (-) 1.5% from (-) 2.6% the previous month. Credit offtake to micro and small segment (MSE) stands at 0.7% growth in September, as against (-) 3.1%, the previous month. Noteworthy - small entities involved in services have posted 1.3% growth in offtake and contributed substantially in this segment.
|
Key indicators in money market |
FY17 |
2016 |
2017 |
||
|
Aug. |
Sep. |
Aug. |
Sep. |
||
|
Deposit (% change) |
11.3 |
8.9 |
10.8 |
8.9 |
8.6 |
|
Non-food Credit (% change) |
5.2 |
9.1 |
10.2 |
7.1 |
7.4 |
|
Credit-Deposit Ratio |
72.9 |
74.4 |
74.3 |
72.6 |
73.0 |
|
Incremental Credit-Deposit Ratio |
41.4 |
-2.2 |
32.0 |
** |
79.8 |
|
Investment-Deposit Ratio |
28.2 |
29.0 |
28.3 |
31.0 |
30.4 |
|
Incremental Investment-Deposit Ratio |
28.4 |
49.3 |
30.2 |
* |
146.8 |
Source: RBI, SMERA Knowledge Center
Sector-wise growth in credit offtake (% YoY in outstanding):
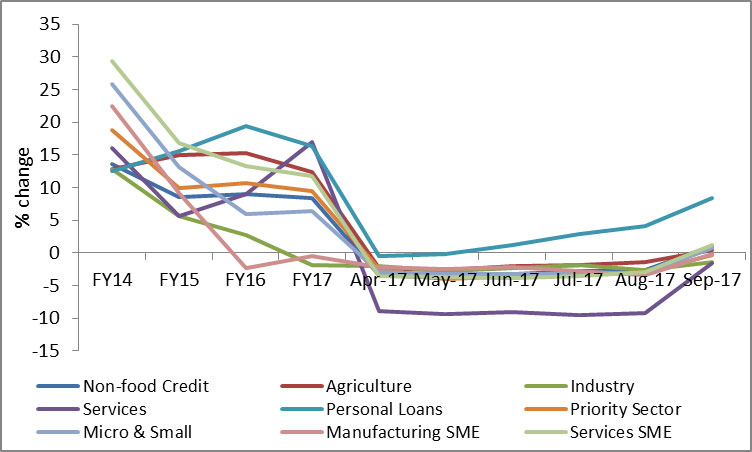
Source: RBI, SMERA Knowledge Center
 +91 99698 98000
 info@acuite.in
 Follow us
 +91 22 49294000
 DOWNLOAD