Impact: Positive (Low Inflationary Tendency), Positive (Monetary Policy)
Brief: Consumer
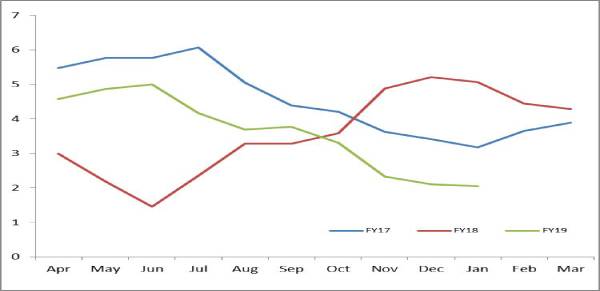
inflation slipped to a eighteen-month low of 2.1% in January, 2018, nearly 165
bps fall in last four months. This
tendency has led us to believe that the supposed undershooting of the consumer
inflation is because of the higher weight attributed to food articles. At the
same time, consumers are increasing spending on discretionary items, healthcare
and education. A redistribution of the index is therefore a need of the
hour.
Consumer
inflation slipped to a eighteen-month low of 2.1% in December, 2018. There is
nearly 165 bps fall in last four months. We are expecting the overall consumer
inflation for FY19 to be pegged at 3.8% level (with minor variance). The
forecast gives due cognizance to the evolving food and fuel story along with
discretionary spend. Consideration also involves recent developments in oil
market, which we reckon will support food items - lowering overall inflation rate.
There are several reasons for
this outcome and obsolete weightage tops the list. The CPI is essentially a
combination of Headline and Core inflation numbers. While the former includes
Food & Fuel prices, the latter contains all other items, which are
essential in a household’s basket (representing both discretionary and
non-discretionary spending) – excluding food and fuel categories. As food
prices have been perpetually low, the Headline component’s representation of a
total of 45.9% in the overall consumer index is somewhat subdued.
A sub-category level trend shows that while core inflation stood at 5.45% during the said period, food inflation as a standalone metric stood at -2.17%. This tendency has led us to believe that the supposed undershooting of the consumer inflation is because of the higher weight attributed to food articles. Food items account for 39% in India’s overall consumer inflation basket - strengthens our hypothesis.
If we compare India’s CPI weightages to that of its BRICS peers, the disparities become starker. As mentioned, while India’s food basket has been allocated nearly 39%, the category’s share is only 25.5% and 19.1% in Brazil and South Africa, respectively. While it is understood that both these contemporaries are termed upper middle income countries as compared to India’s classification of lower middle income, the latter is fast approaching that target. This is because India has been averaging a GDP growth of 7.5% (over a period of ten years) as compared to the other two, averaging less than 3%.
While analyzing other segments of the CPI basket, it is heartening to note that spend on healthcare, education and lifestyle items remains strong. This development pertains to the rising standards of living and rearrangement of the household income fund. As households begin to spend more on discretionary and non-discretionary items, the prominence of food declines over time – a sign of a matured economy driven by diverse consumption categories. Inflation in protein based items such as Meat and Fish (+5.1%) is sign of things to come; the healthy supply side in Milk and Pulse categories has however diluted the trend. Discretionary items are also showing a strong growth trend signifying inflationary tendencies in the core category.
Considering this, what is confusing is the fact that while India’s per-capita Income is growing at 5.8%, the price of food articles is in negative zone. It is evident that through the effective implementation of the MSP regime and bettering logistic support, India may have controlled its food inflation substantially. Price control of seasonal fruits and vegetables (along with high growth protein based items is recent past) is therefore overwhelming other categories, which are more inflationary but represent a lower weightage.
Items
such as Housing, Amusement/ Recreational expenses, Consumer Durables, FMCG and
Transportation have gained in prominence over time but continue to represent a
lower weightage in the overall price index. We believe this must change and
weightage of the Indian consumer price index must represent the evolving ground
realties of the Indian economy. A redistribution of the index is therefore a
need of the hour. Given in ineffectiveness of the MSP regime and its failure to
be the ‘floor price’ in agro trading, improvisations have to be more
structural.
Category wise Weight
Distribution:
|
|
India
|
Brazil
|
South Africa
|
|
Food
|
39.06
|
25.52
|
19.15
|
|
Household items
|
3.8
|
4.25
|
4.33
|
|
Housing
|
10.07
|
15.5
|
22.55
|
|
Transportation
|
8.59
|
18.49
|
14.74
|
|
Clothing
|
5.58
|
5.99
|
4.04
|
|
Health & personal
care
|
9.79
|
11.1
|
1.26
|
|
Personal expenses
|
1.68
|
10.62
|
4.86
|
|
Education
|
4.46
|
4.71
|
2.34
|
|
Communication
|
#
|
3.82
|
2.62
|
|
Others
|
10.13
|
*
|
24.11
|
|
Overall Index
|
100
|
100
|
100
|
|
|
General
|
Food
|
Fuel & light
|
|
FY13
|
10.05
|
11.07
|
9.67
|
|
FY14
|
9.38
|
12.09
|
7.67
|
|
FY15
|
5.83
|
6.36
|
4.21
|
|
FY16
|
4.91
|
4.88
|
5.27
|
|
FY17
|
4.52
|
4.23
|
3.29
|
|
FY18
|
3.59
|
1.80
|
6.2
|
|
FY19 YTD
|
3.56
|
0.22
|
6.55
|
 Source: RBI
Note: Net injection (+) and Net absorption (-)
 +91 99698 98000
 info@acuite.in
 Follow us
 +91 22 49294000
 DOWNLOAD