Key Highlights:
Liquidity
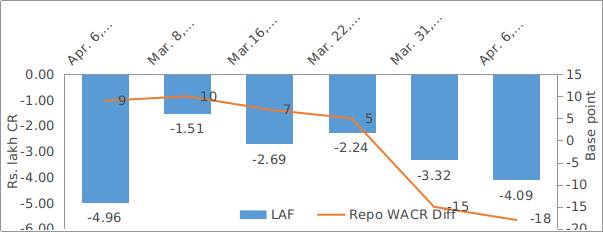
The liquidity condition remains in ex-ante negative zone during the first week of FY20. The repo- WACR differential stands at (-) 18 bps after the RBI’s rate cut announcement. The RBI has trimmed the policy rate by 25 bps to 6% during the first MPC meeting of the fiscal year as the central bank is concerned about the domestic economic outlook. However, as the RBI has scheduled the second currency swap deal during the end of this month, the liquidity situation is expected to improve to the comfortable zone of around 10 bps less than repo rate.
Capital Market
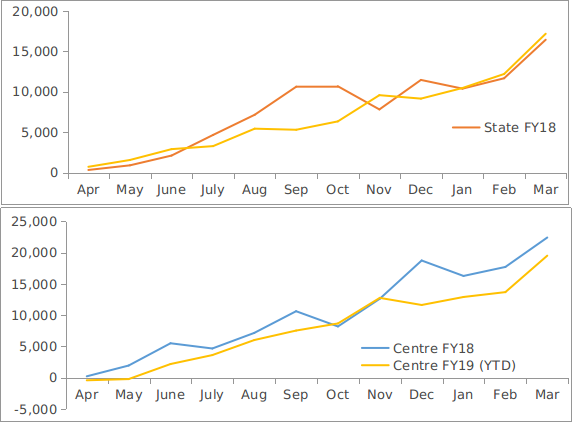
On the domestic capital market front, the 10 year Indian G-Sec yield remains stable at around 7.35% despite a rate cut. The disconnection between the yield and repo rate is because of massive government debt issuances. As per the RBI’s weekly report, the incremental net issuances including centre and state government have reached 10.8 lakh crore during March, 2019. The amount was only Rs.2.5 lakh crore during the previous month. Therefore, massive supply of government securities is slowing the yield to follow the policy rate. From the US capital market perspective, the 10-year US G-Sec yield has increased by 7 bps to 2.55% during the first week of April 2019 as US inflation rate is moving up.
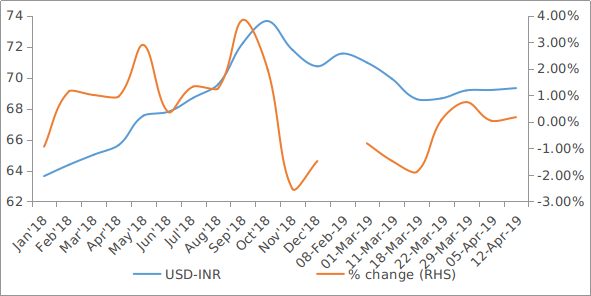
Currency Trend
Indian rupee had reached nine months high of 68.61 against the US dollar during the second week of March 2019. Since then, the domestic currency is on downward trend and declined to 69.32 after a month. We note that the recovery in oil price in the international market will undermine the Indian rupee in a short to medium term period. However, the rupee is expected to be less volatile as India’s forex reserve stands at an all-time high of $413.8 billion during first week of April 2019. Having said that, we remain cognizant of the fact that in the global currency market, the USD index is regaining its strength after an uncertainty emanating from the Brexit.
Market Perspectives from Rating Operations Team:
Fund manager's Dilemma
The recent incidents of downgrades in NCDs and debt instruments of some companies has triggered a panic among debt fund managers, who are left holding such paper at much lower Net Asset Values (NAV). The subsequent media & regulatory backlash against these mutual funds is likely result in adoption of a cautious approach to asset allocation. We believe that the focus of the fund managers will again shift from "Return on Capital” to "Return of Capital”. The continued trust of the retail investors in the debt mutual funds is of paramount importance if the corporate bond market is to be deepened. Perhaps it is a wakeup call for the rating agencies and the fund managers to revisit theirrisk management architecture.
Vinayak Ramkrishna
Nayak
Head - Rating Operations, Large
Corporate
Interest rates and ratio:
|
Interest Rate |
Apr 06 2018 |
Mar 08 2019 |
Mar 15 2019 |
Mar 22 2019 |
Mar 29 2019 |
Apr 05 2019 |
|
Policy Repo Rate |
6.00 |
6.25 |
6.25 |
6.25 |
6.25 |
6.00 |
|
Call Money Rate (WA) |
5.91 |
6.15 |
6.18 |
6.20 |
6.35 |
6.18 |
|
364-Day Treasury Bill Yield |
6.49 |
6.51 |
6.49 |
6.42 |
6.39 |
6.31 |
|
2-Yr Indian G-Sec |
6.73 |
6.55 |
6.59 |
6.51 |
6.57 |
6.69 |
|
10-Yr Indian G-Sec |
7.20 |
7.36 |
7.33 |
7.33 |
7.34 |
7.37 |
|
10-Yr US G-Sec |
2.77 |
2.59 |
2.44 |
2.43 |
2.48 |
2.55 |
|
Spread in bps (10Yr Indian-10Yr US) |
443 |
477 |
489 |
490 |
486 |
482 |
|
AAA Indian Corporate |
8.05 |
8.58 |
8.55 |
8.36 |
8.38 |
8.42 |
|
AA Indian Corporate |
8.17 |
- |
- |
- |
- |
- |
|
Spread AAA to10 YR Indian bond |
85 |
122 |
122 |
103 |
104 |
105 |
|
Credit/Deposit Ratio |
- |
- |
78.14 |
- |
77.69 |
- |
|
USD LIBOR (3 month) |
2.59 |
2.62 |
2.60 |
2.59 |
2.59 |
2.60 |
Source: RBI, Investing.com
Acuité Portfolio Debt Instrument Benchmark Estimates (as on 17 April 2019):
|
Category |
10-Yr Corporate Yield to Maturity (YTM) |
|
AAA* |
NA |
|
AA+ |
7.82% |
|
AA |
8.61% |
Source: Acuité Research; # Discount Factor: 0.0627
|
|
Deposit (In Rs. Lakh cr) |
Bank Credit (In Rs. Lakh cr) |
|
As on Mar 29, 2019 |
1,25,725.9 |
97,674.3 |
|
As on Jan 04, 2019 |
1,20,337.6 |
93,374.5 |
|
As on Mar 30, 2018 |
1,14,260.5 |
86,254.2 |
|
YTD (% change) |
4.48% |
4.60% |
|
YoY (% change) |
10.03% |
13.24% |
Source: RBI
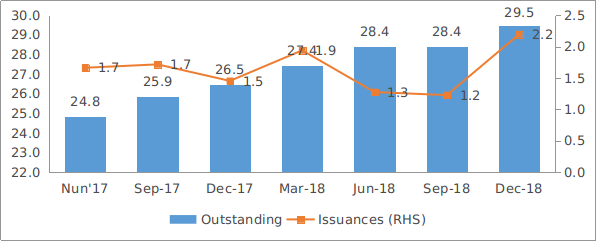
Money Market Performance
|
Commercial Paper (Fortnight): |
Outstanding (In Rs. Lakh cr) |
Amount issued (In Rs. Lakh cr) |
|
31-Mar-2019 |
4,830.8 |
1013.0 |
|
28-Feb-2019 |
5,208.1 |
900.8 |
|
31-Mar-2018 |
3,725.8 |
999.2 |
|
% Change (MoM) |
-7.24% |
12.45% |
|
% Change (YoY) |
29.66% |
1.38% |
Source: RBI
Indices
|
|
13-Apr-18 |
22-Mar-19 |
29-Mar-19 |
05-Apr-19 |
12-Apr-19 |
|
NSE Index |
10,480.60 |
11,456.90 |
11,623.90 |
11,665.95 |
11,643.45 |
|
NSE Index Return |
1.44 |
-0.56 |
0.47 |
0.59 |
0.4 |
|
BSE Index |
34,192.65 |
38,164.61 |
38,672.91 |
38,862.23 |
38,767.11 |
|
BSE Index Return |
1.68 |
-0.58 |
0.33 |
0.46 |
0.41 |
 Source: RBI
Note: Net injection (+) and Net absorption (-)
Net Debt Issuance by Centre and State Government (Rs. Billion):
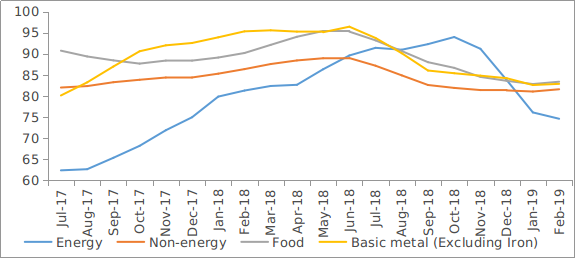
Commodity Price Index (3 Month Moving Average):
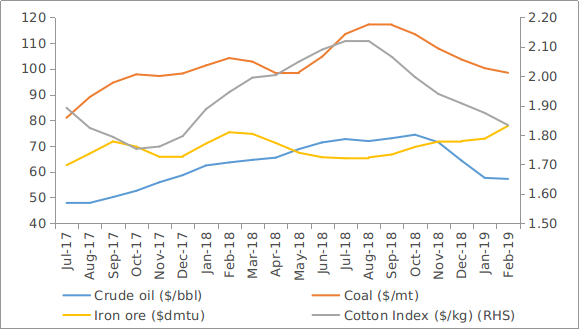
Commodity Price Movement (3 Month Moving Average):
Corporate debt (in Rs. Lakh Cr):
USD-INR Movement:
 Source: RBI, Acuité Research
 +91 99698 98000
 info@acuite.in
 Follow us
 +91 22 49294000
 DOWNLOAD