Key Highlights
Liquidity
The weighted average call money rate reduced to 5.45% during the second week of August 2019. The over-night lending rate has fallen by 18 bps over a week time to adjust with the revised repo rate. During the week, the banking sector had average surplus liquidity of Rs. 1.58 lakh crore. The excess liquidity is result of subdued credit offtake. Due to impair credit offtake, the credit deposit ratio has been declining continuously. This is indicating further fading in economic activities. However, commercial banks’ recent decision to cut in lending rates along with lower commodity prices will give a fillip to the private consumption.
Capital Market
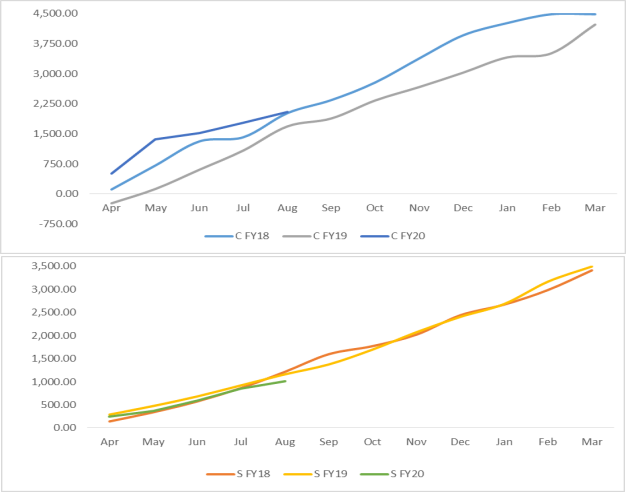
On the global capital market perspective, the sovereign bond yield of advance economies has been continuing its downward trend. This indicates the investors are preferring safe assets. As a result, the 10-yr US sovereign yield has further subsided to 1.56% during the second week of Aug 2019 – 130 bps lower than the same time the previous year. Similarly, 10-yr G-sec yield of Japan and Switzerland (in negative trajectory) has reduced by 1.15 and 16 bps respectively over the week time. As investors are parking their money in save heaven, the gold price has increased by above 20% YoY in Aug 2019. Due to global and domestic factors, the 10-yr Indian G-sec has increased by 14 bps to 6.64% during the week time. On the domestic side, central government’s debt issuance has increased by 21% in FY20 (YTD) over the same time previous year; the government is frontloading the system in order to steroid the economic outlook. Moreover, market is expecting the central government to announce stimulus package. Due to above factors, the spread between 10-yr Indian and US sovereign yield has reached eleven month high of 508 bps.
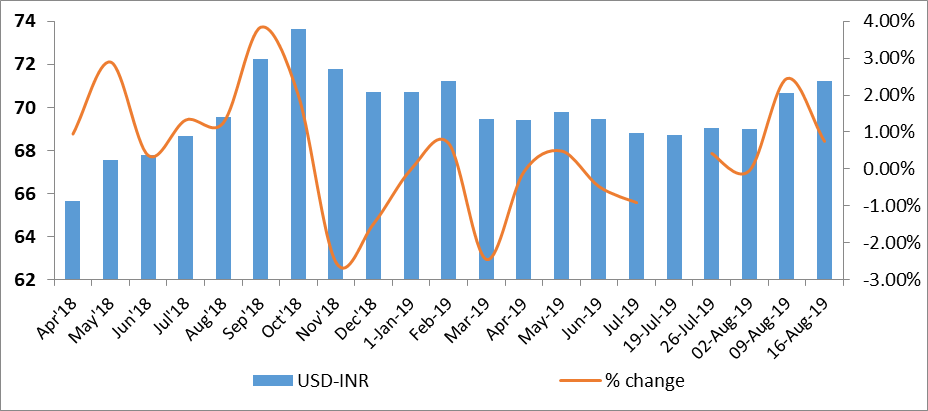
Currency Trend
Currency of emerging markets is under pressure due to higher capital outflows. Indian rupee has hit seven month high of 71.21 against the US dollar. The RBI has been buying dollar in the forward market – this is further weakening Indian rupee. The forward premia for USD-INR has been declining as interest rate spread between LIBOR and MIBOR has reduced. This is indicating Indian rupee is likely to strengthen in near future.
Interest rates and ratio:
|
Interest Rate |
Aug 10 |
July 12 |
July 19 |
July 26 |
Aug 2 |
Aug 9 |
|
2018 |
2019 |
2019 |
2019 |
2019 |
2019 |
|
|
Policy Repo Rate |
6.5 |
5.75 |
5.75 |
5.75 |
5.75 |
5.40 |
|
Call Money Rate (WA) |
6.35 |
5.62 |
5.61 |
5.59 |
5.58 |
5.45 |
|
364-Day Treasury Bill Yield |
7.28 |
6.06 |
5.98 |
5.98 |
5.94 |
5.85 |
|
2-Yr Indian G-Sec |
7.64 |
6.06 |
6.1 |
6.01 |
5.91 |
5.90 |
|
10-Yr Indian G-Sec |
7.74 |
6.56 |
6.45 |
6.62 |
6.50 |
6.64 |
|
10-Yr US G-Sec |
2.86 |
2.06 |
2.07 |
1.84 |
1.75 |
1.56 |
|
AAA (Indian corporate) |
7.81 |
8.3 |
7.42 |
7.76 |
7.5 |
6.96 |
|
Spread in bps (10Yr Indian- US) |
488 |
450 |
438 |
478 |
475 |
508 |
|
Credit/Deposit Ratio |
74.93 |
- |
76.35 |
- |
76.34 |
- |
|
USD LIBOR (3 month) |
1.9163 |
2.3590 |
2.3606 |
2.3504 |
2.1043 |
2.0953 |
|
Forward Premia of US$ 1-month |
4.52 |
4.02 |
4.01 |
4.00 |
3.98 |
3.74 |
|
US$ 3-month |
4.35 |
4.19 |
4.15 |
4.09 |
4.09 |
3.86 |
|
US$ 6-month |
4.35 |
4.43 |
4.33 |
4.31 |
4.18 |
3.94 |
Acuité Portfolio Debt Instrument Benchmark
Estimates (as on Aug 19, 2019):
|
Category |
10-Yr Corporate Yield to Maturity |
|
AAA* |
NA |
|
AA+ |
7.66% |
|
AA |
8.63% |
|
|
Deposit (In Rs. Lakh cr) |
Bank Credit (In Rs. Lakh cr) |
|
As on Aug 02,2019 |
127.45 |
97.3 |
|
As on July 05,2019 |
126.75 |
96.97 |
|
As on Aug 03,2018 |
124.32 |
86.73 |
|
YTD (% change) |
0.55% |
0.34% |
|
YoY (% change) |
2.52% |
12.19% |
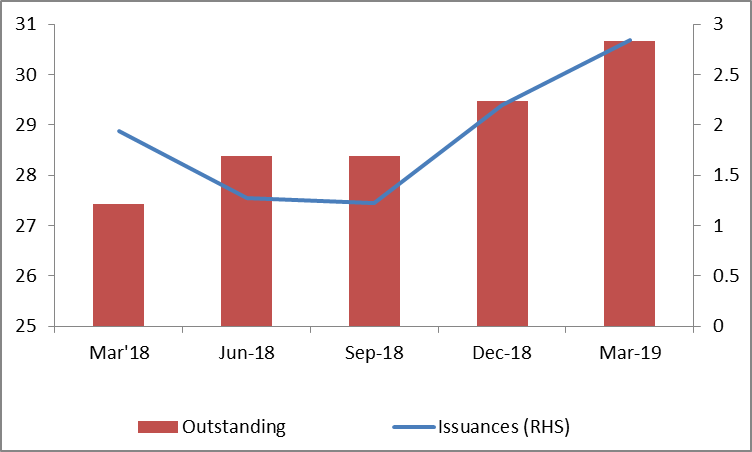
Money Market Performance
|
Commercial Paper (Fortnight): |
Outstanding (In Rs. Billion) |
Amount issued (In Rs. Billion) |
|
30-Jun-19 |
5,039.40 |
1076.9 |
|
15-Jun-19 |
5,561.80 |
1078.7 |
|
30-Jun-18 |
4,918.30 |
1267.3 |
|
% Change (MoM) |
-9.39% |
-0.17% |
|
% Change (YoY) |
2.46% |
-15.02% |
Indices
|
|
17-Aug-18 |
26-Jul-19 |
02-Aug-19 |
09-Aug-19 |
16-Aug-19 |
|
NSE Index |
11,470.75 |
11,284.30 |
10,997.35 |
11,109.65 |
11,047.80 |
|
NSE Index Return |
0.36 |
-1.18 |
-2.54 |
1.02 |
-0.56 |
|
BSE Index |
37,947.88 |
37,882.79 |
37,118.22 |
37,581.91 |
37,350.33 |
|
BSE Index Return |
0.21 |
-1.18 |
-2.02 |
1.25 |
-0.62 |
Liquidity Operation by RBI
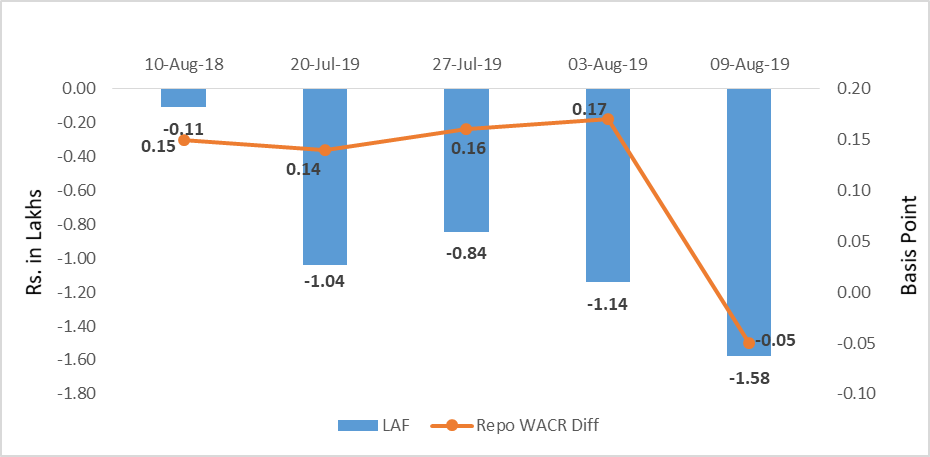
Source: RBI, Acuité Research; Note: Net injection (+) and Net absorption (-)
Corporate debt (in Rs. Lakh Cr)
Net Debt Issuance by Centre and State Government (Rs. Billion)
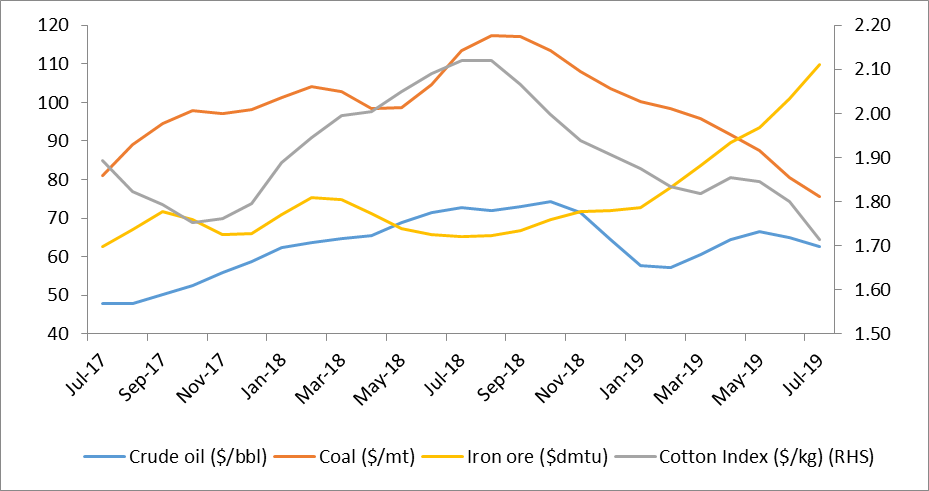
Commodity Price Index (3 Month Moving Average)
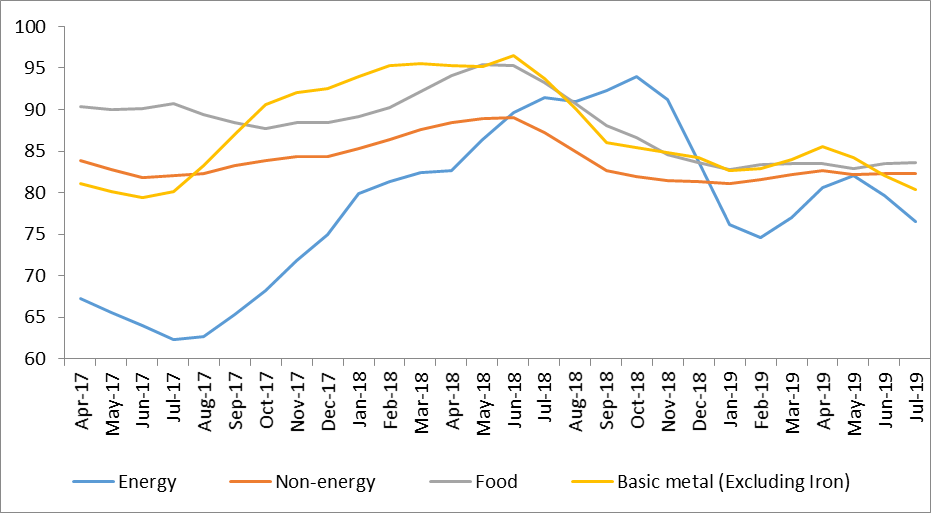
Commodity Price Movement (3 Month Moving Average)
USD-INR Movement
Source: RBI, Acuité Research
 +91 99698 98000
 info@acuite.in
 Follow us
 +91 22 49294000
 DOWNLOAD