Key Highlights:
·The liquidity condition in the domestic market has remained marginally tight during last week of January, 2019
·The repo-WACR differential has dropped to 7 bps
·RBI has infused Rs. 40,000 crores through OMO operation in the month of January alone
·We estimate that India’s fiscal deficit target would slip by 10 bps to 3.4% of GDP in FY19
·Central government continues its expansionary fiscal policy in FY20 as well and target fiscal deficit at 3.4% of GDP
·10-year G-Sec yield witnessed a sharp increase due to rise in issuances
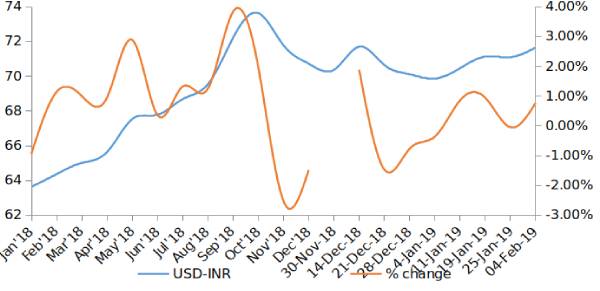
·Indian rupee has depreciated by 0.77% to 71.66 in First week of February
Liquidity
The liquidity condition in the domestic market has remained marginally tight during last week of January, 2019. The repo-WACR differential has dropped to 7 bps. It is known that RBI has infused Rs. 40,000 crores through OMO operation in January alone. This gives a sense of tight liquidity condition in the banking sector. Not to mention the Credit deposit ratio also stands at 77.85. Similarly, credit offtake remains strong at 14.6% during the first half of January, 2019. Deposit growth, on the other hand has been growing at 9.7% during the period.
On a positive note, RBI has lifted lending restrictions on three Public Sector Banks (PSBs, namely, Bank of India, Bank of Maharashtra, and Oriental Bank of Commerce). We reckon that the move will further boost the credit offtake in the coming months.
Capital Market:
Capital market remained volatile and derived concerns from the Fed’s uncertain monetary policy outlook and the lack of clarity from the Indian Government’s fiscal target range (prior to the Budget FY20). While the FOMC hinted on pausing its monetary tightening cycle, the Indian government, on the other hand confirmed its fiscal deficit target slipping by 10 bps to 3.4% of GDP in FY19. The Indian central government continues its expansionary fiscal policy in FY20 as well and keeps fiscal deficit target unchanged at 3.4% of GDP. As a market’s reaction to India’s fiscal target, 10-year G-Sec yields witnessed a sharp increase. We expect that the 10 year G-Sec yield to remain high in FY20.
Currency Trend:
Indian rupee has depreciated by 0.77% to 71.66 in the first week of February. Global currency market witnesses some movement on account of geo-political adversity emanating from Venezuela. Crude price saw a sharp increase after the US imposed sanctions on the Latin American oil exporter. On the other hand, FOMC was a source of positive news for the market as it hinted a dovish stance. The Fed believes that inflation rate and economic outlook in the US are stable and this has significantly tempered the market’s rate hike expectations.
Interest rates and ratio
|
Interest Rate |
Jan.,26 2018 |
Dec.28, 2018 |
Jan.04, 2019 |
Jan.11, 2019 |
Jan.,21 2019 |
Jan.,25 2019 |
|
Policy Repo Rate |
6.00 |
6.50 |
6.50 |
6.50 |
6.50 |
6.50 |
|
Call Money Rate (WA) |
5.90 |
6.57 |
6.35 |
6.35 |
6.41 |
6.43 |
|
364-Day Treasury Bill Yield |
6.55 |
6.42 |
6.91 |
6.88 |
6.83 |
6.82 |
|
2-Yr Indian G-Sec |
6.80 |
7.08 |
6.99 |
7.00 |
6.99 |
7.02 |
|
10-Yr Indian G-Sec |
7.27 |
7.41 |
7.45 |
7.27 |
7.32 |
7.35 |
|
10-Yr US G-Sec |
2.62 |
2.64 |
2.69 |
2.69 |
2.74 |
2.68 |
|
Spread in bps (10Yr Indian-10Yr US) |
465 |
477 |
476 |
458 |
458 |
467 |
|
AAA Indian Corporate |
7.93 |
8.48 |
8.57 |
8.55 |
8.55 |
8.62 |
|
AA Indian Corporate |
8.51 |
9.35 |
8.93 |
8.48 |
- |
- |
|
Spread AAA to10 YR Indian bond |
66 |
107 |
112 |
128 |
123 |
127 |
|
Credit/Deposit Ratio |
74.42 |
- |
77.60 |
- |
77.85 |
- |
|
USD LIBOR |
2.02 |
2.75 |
2.80 |
2.78 |
2.77 |
2.75 |
Source: RBI, Investing.com
|
|
Deposit (In Rs. Lakh cr) |
Bank Credit (In Rs. Lakh cr) |
|
As on Jan 18, 2019 |
1,19,865 |
93,317 |
|
As on Jan 04, 2018 |
1,20,338 |
93,374 |
|
As on Jan 18, 2018 |
1,09,274 |
81,420 |
|
YTD (% change) |
-0.39% |
-0.06% |
|
YoY (% change) |
9.69% |
14.61% |
Source: RBI
Money Market Performance
|
Commercial Paper (Fortnight): |
Outstanding (In Rs. Lakh cr) |
Amount issued (In Rs. Lakh cr) |
|
15-Jan-2019 |
5.54 |
1.01 |
|
31-Dec-2018 |
4.99 |
0.96 |
|
15-Jan-2018 |
4.70 |
0.91 |
|
% Change (MoM) |
11.09% |
5.44% |
|
% Change (YoY) |
17.96% |
10.59% |
Source: RBI
Indices
|
|
02-Feb-18 |
11-Jan-19 |
18-Jan-19 |
25-Jan-19 |
02-Feb-19 |
|
NSE Index |
10,492.85 |
10,794.95 |
10,906.95 |
10,780.55 |
10,893.65 |
|
NSE Index Return |
-4.85 |
-0.25 |
0.02 |
-0.64 |
0.58 |
|
BSE Index |
34,184.04 |
36,009.84 |
36,386.61 |
36,025.54 |
36,469.43 |
|
BSE Index Return |
-4.95 |
-0.27 |
0.03 |
-0.47 |
0.59 |
Liquidity Operation by RBI:
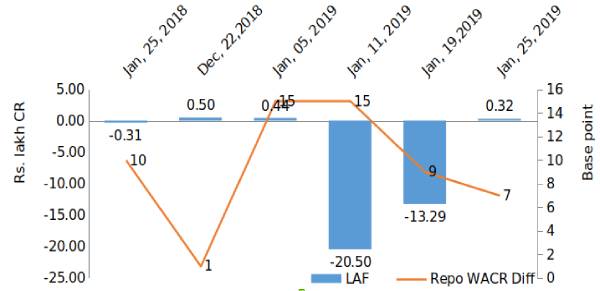 Source: RBI
Note: Net injection (+) and Net absorption (-)
Net Debt Issuance by Centre and State Government:
Source: RBI, Acuité Research
Commodity Price Index (3 Month Moving Average):
Commodity Price Movement (3 Month Moving Average):
USD-INR Movement
 Source: RBI, Acuité Research
 +91 99698 98000
 info@acuite.in
 Follow us
 +91 22 49294000
 DOWNLOAD