Key Highlights:
Liquidity
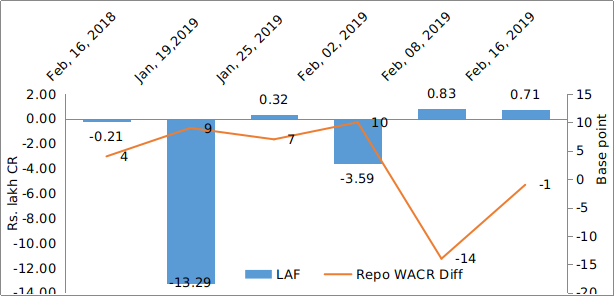
Liquidity condition in the domestic market has marginally improved, but still remains tight. The Repo-WACR differential stands at (-) 1 base point in the third week of February, 2019, as compared to (-)14 bps a week earlier. The improvement in the liquidity condition has its roots firmly attached to the RBI’s infusion of Rs. 12,500 crores through OMO operations during the third week of February. The Credit Deposit ratio also hints of tight liquidity conditions in the days to come. The deposit has been growing at a pace of around 9% while credit offtake, on the other hand, continues to expand at over 14%. Going ahead, as RBI has trimmed its policy rate by 25 bps, the credit offtake is expected to accelerate further. We reckon that this will adversely impact the liquidity condition though.
Capital Market:
The 10-year Indian G-sec bond yield has witnessed a sharp increase as it jumped 24 bps to 7.58% during the third week of February, 2019. It is known that the Central government’s expansionary fiscal policy has been already putting upward pressure on the bond yields. This has been acting in combination with the rising American yields, which are in turn under pressure from the inconclusive China trade negotiations. However, this yield spurt was supressed by the RBI’s open market operations. Not to mention, RBI has infused Rs. 32,500 crores over the last three weeks. Going ahead, we are expecting the Indian G-sec yield to remain high.
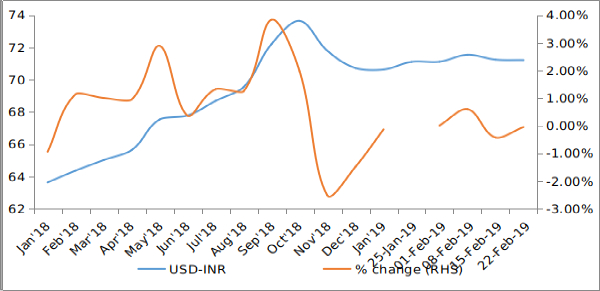
Currency Trend:
Currency market has been witnessing some stability over the past two weeks. The USD-INR currency pair has been trading at around 71.2 for past two weeks. RBI’s monthly bulletin for February indicates improvement in capital inflows. India’s net FII inflows during December, 2018 were $3.76 billion as against $2.55 billion a month earlier. We understand that average net FPI inflows during March, 2018 to Oct, 2018 was (-) $2.4 billion. Therefore, stability in capital market will reduce volatility in the currency market. Moreover, normalization in crude oil price will further positively impact the Indian rupee.
Interest rates and ratio:
|
Interest Rate |
Feb.,16 2018 |
Jan.,21 2019 |
Jan.,25 2019 |
Feb.,01 2019 |
Feb.,08 2019 |
Feb.,15 2019 |
|
Policy Repo Rate |
6.00 |
6.50 |
6.50 |
6.50 |
6.25 |
6.25 |
|
Call Money Rate (WA) |
5.96 |
6.41 |
6.43 |
6.40 |
6.39 |
6.26 |
|
364-Day Treasury Bill Yield |
6.58 |
6.83 |
6.82 |
6.78 |
6.78 |
6.51 |
|
2-Yr Indian G-Sec |
6.81 |
6.99 |
7.02 |
6.80 |
6.75 |
6.80 |
|
10-Yr Indian G-Sec |
7.56 |
7.32 |
7.35 |
7.38 |
7.34 |
7.58 |
|
10-Yr US G-Sec |
2.87 |
2.74 |
2.68 |
2.63 |
2.66 |
2.68 |
|
Spread in bps (10Yr Indian-10Yr US) |
469 |
458 |
467 |
475 |
468 |
490 |
|
AAA Indian Corporate |
8.55 |
8.55 |
8.62 |
8.67 |
8.70 |
8.78 |
|
AA Indian Corporate |
8.50 |
- |
- |
- |
- |
- |
|
Spread AAA to10 YR Indian bond |
99 |
123 |
127 |
129 |
136 |
120 |
|
Credit/Deposit Ratio |
74.65 |
77.85 |
- |
77.79 |
- |
- |
|
USD LIBOR |
2.73 |
2.77 |
2.75 |
- |
- |
2.68 |
Source: RBI; CMIE; Investing.com
Acuité Portfolio Debt Instrument Benchmark Estimates (as on 25th Feb 2019):
|
Category |
10-Yr Corporate Yield to Maturity |
|
AAA* |
8.32% |
|
AA+ |
8.39% |
|
AA |
8.85% |
Source: Acuité Research; # Discount Factor: 0.0625; *Outside Benchmark
|
|
Deposit (In Rs. Lakh cr) |
Bank Credit (In Rs. Lakh cr) |
|
As on Feb 01, 2019 |
1,21,227.6 |
94,298.5 |
|
As on Jan 18, 2018 |
1,19,859.8 |
93,325.6 |
|
As on Feb 02, 2018 |
1,10,575.9 |
82,334.7 |
|
YTD (% change) |
1.14% |
1.04% |
|
YoY (% change) |
9.63% |
14.53% |
Source: RBI
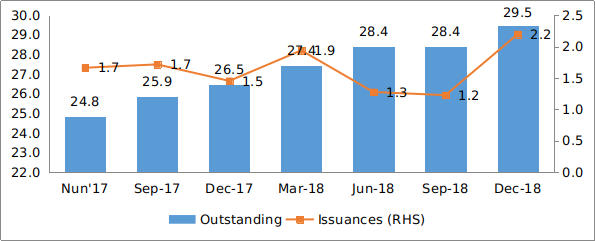
Money Market Performance
|
Commercial Paper (Fortnight): |
Outstanding (In Rs. Lakh cr) |
Amount issued (In Rs. Lakh cr) |
|
15-Feb-2019 |
5,242.3 |
1,035.5 |
|
31-Jan-2018 |
5,287.4 |
1,073.9 |
|
15-Feb-2018 |
4,886.3 |
1,037.7 |
|
% Change (MoM) |
-0.85% |
-3.58% |
|
% Change (YoY) |
7.29% |
-0.22% |
Source: RBI
Indices
|
|
21-Feb-18 |
02-Feb-19 |
08-Feb-19 |
15-Feb-19 |
22-Feb-19 |
|
NSE Index |
10,492.85 |
10,893.65 |
10,943.60 |
10,724.40 |
10,789.85 |
|
NSE Index Return |
-4.85 |
0.58 |
-1.14 |
-0.2 |
0.51 |
|
BSE Index |
34,184.04 |
36,469.43 |
36,546.48 |
35,808.95 |
35,871.48 |
|
BSE Index Return |
-4.95 |
0.59 |
-1.15 |
-0.19 |
-0.07 |
 Source: RBI
Note: Net injection (+) and Net absorption (-)
Net Debt Issuance by Centre and State Government:
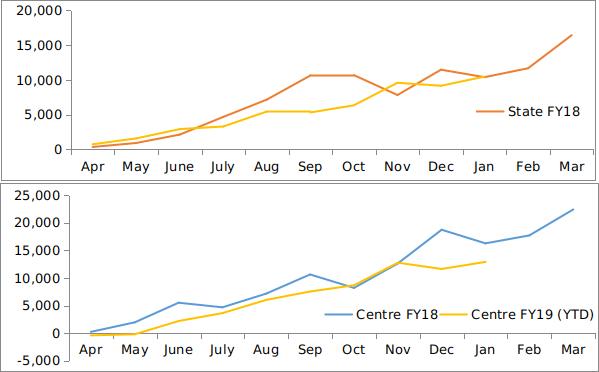 Source: Acuité Research, RBI
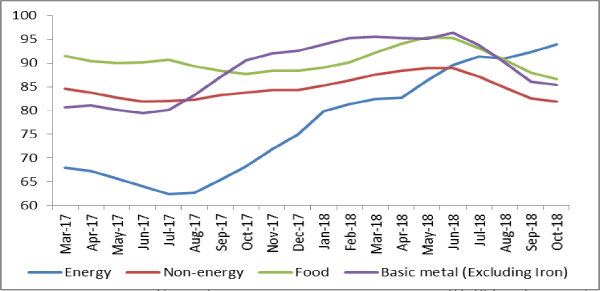
Commodity Price Index (3 Month Moving Average):
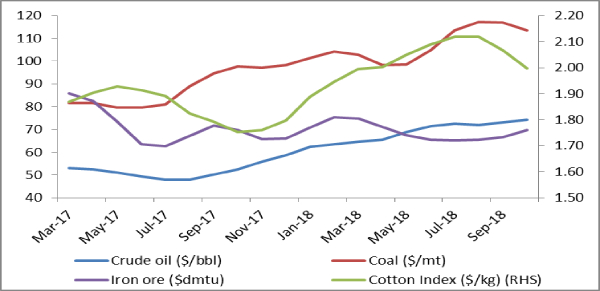
Commodity Price Movement (3 Month Moving Average):
Corporate debt (in Rs. Lakh Cr):
USD-INR Movement:
 Source: RBI, Acuité Research
 +91 99698 98000
 info@acuite.in
 Follow us
 +91 22 49294000
 DOWNLOAD