Key Highlights:
·Liquidity condition in the domestic market seems to be in the comfortable zone though the Repo-WACR differential has marginally declined
·The credit offtake and deposit continue to expand by 14.5 and 9.9% respectively.
·The credit deposit ratio dropped to 77.5 in January, 2019 from 78.6 of December, 2018.
·The Indian 10- year G-Sec yield has increased from 7.27% to 7.32% over a week.
·364 days T-bill, a short term instrument, on the other hand, dropped by 5 bps to 6.83%.
·The currency pair is highly volatile as two major events in the current week are impending. First, the Federal Reserve’s bi-monthly Fed meeting is due on 30th January. Second, Indian union budget is scheduled on 1st February.
Liquidity
Liquidity condition in the domestic market seems to be in the comfortable zone though the Repo-WACR differential has marginally declined. The credit offtake and deposit continue to expand by 14.5 and 9.9% respectively. The credit deposit ratio dropped to 77.5 in January, 2019 from 78.6 of December, 2018. Softening C-D ratio gives a sense of improved liquidity conditions in the days to come. On a commercial paper front, the year on year growth in commercial paper issuances is on a positive trend for past two and half months. This indicates that corporates have started to see the money markets as a viable alternative to raising funds again.
Capital Market:
Capital market seems to be less volatile in third week of January, 2019. The 10-year US G-Sec yield, the benchmark yield, has increased by 5 bps from 2.69% in January 11 to 2.74% in January, 18. The Indian G-Sec yield for the same duration has increased from 7.27% to 7.32% during the reference period. 364 days T-bill, a short term instrument, on the other hand, dropped by 5 bps to 6.83%. However, since India’s fiscal deficit is expected to exceed its target, the bond yield is likely to increase in months to come.
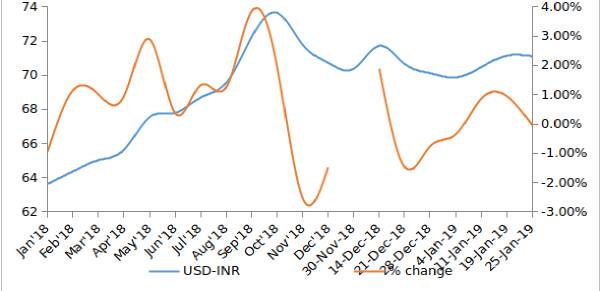
Currency Trend:
Due to higher capital mobility in the equity market, the USD-INR currency pair was highly volatile, the previous week. The impact comes due to two major events that are impending in the current week. First, the Federal Reserve’s bi-monthly Fed meeting is due on 30th January. Second, Indian union budget is scheduled on 1st February. As Fed’s stance on monetary policy is unclear, the currency market is highly volatile. At the same time, market will get precision on India’s fiscal target with the budgetary allocations and outlook. In the coming weeks, the behaviour of currency pair will therefore be driven by the outcome of these two events.
Interest rates and ratio
|
Interest Rate |
Jan.,19 2018 |
Dec.21, 2018 |
Dec.28, 2018 |
Jan.04, 2019 |
Jan.11, 2019 |
Jan.,18 2019 |
|
Policy Repo Rate |
6.00 |
6.5 |
6.50 |
6.50 |
6.50 |
6.50 |
|
Call Money Rate (WA) |
5.90 |
6.49 |
6.57 |
6.35 |
6.35 |
6.41 |
|
364-Day Treasury Bill Yield |
6.55 |
6.97 |
6.42 |
6.91 |
6.88 |
6.83 |
|
2-Yr Indian G-Sec |
6.85 |
7.04 |
7.08 |
6.99 |
7.00 |
6.99 |
|
10-Yr Indian G-Sec |
7.26 |
7.26 |
7.41 |
7.45 |
7.27 |
7.32 |
|
10-Yr US G-Sec |
2.66 |
2.71 |
2.64 |
2.69 |
2.69 |
2.74 |
|
Spread in bps (10Yr Indian-10Yr US) |
460 |
455 |
477 |
476 |
458 |
458 |
|
AAA Indian Corporate |
7.93 |
8.65 |
8.48 |
8.57 |
8.55 |
8.55 |
|
AA Indian Corporate |
8.51 |
- |
9.35 |
8.93 |
8.48 |
- |
|
Spread AAA to10 YR Indian bond |
67 |
139 |
107 |
112 |
128 |
123 |
|
Credit/Deposit Ratio |
74.42 |
78.59 |
- |
77.60 |
- |
- |
|
USD LIBOR |
|
2.82 |
2.75 |
2.80 |
2.78 |
|
Source: RBI, Investing.com
|
|
Deposit (In Rs. Lakh cr) |
Bank Credit (In Rs. Lakh cr) |
|
As on Jan 04, 2019 |
120.34 |
93.38 |
|
As on Jan 21, 2018 |
118.16 |
92.88 |
|
As on Jan 05, 2018 |
109.49 |
81.53 |
|
YTD (% change) |
1.84% |
0.55% |
|
YoY (% change) |
9.91% |
14.54% |
Source: RBI
|
Commercial Paper (Fortnight): |
Outstanding (In Rs. Lakh cr) |
Amount issued (In Rs. Lakh cr) |
|
15-Jan-2019 |
5.54 |
1.01 |
|
15-Dec-2018 |
5.46 |
1.03 |
|
15-Jan-2018 |
4.70 |
0.91 |
|
% Change (MoM) |
-2.57% |
1.45% |
|
% Change (YoY) |
17.96% |
10.59% |
Source: RBI
Indices
|
|
25-Jan-18 |
04-Jan-2019 |
11-Jan-19 |
18-Jan-19 |
25-Jan-19 |
|
NSE Index |
11,069.65 |
10,727.35 |
10,794.95 |
10,906.95 |
10,780.55 |
|
NSE Index Return |
1.61 |
0.52 |
-0.25 |
0.02 |
-0.64 |
|
BSE Index |
36,050.44 |
35,695.10 |
36,009.84 |
36,386.61 |
36,025.54 |
|
BSE Index Return |
1.52 |
0.51 |
-0.27 |
0.03 |
-0.47 |
Liquidity Operation by RBI:
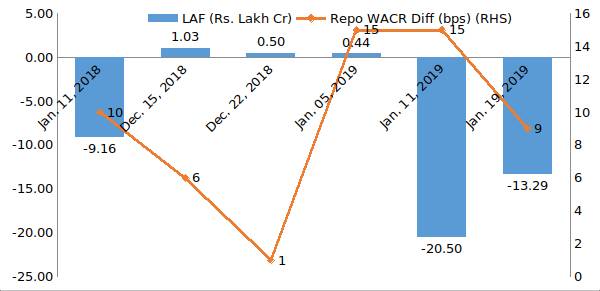 Source: RBI
Note: Net injection (+) and Net absorption (-)
Corporate Bond Position (in Rs. lakh cr):
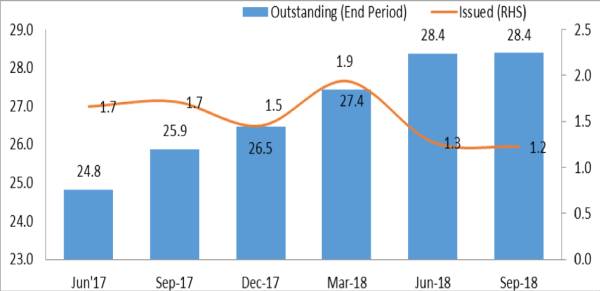 Source: RBI, Acuité Research
Net Debt Issuance by Centre and State Government:
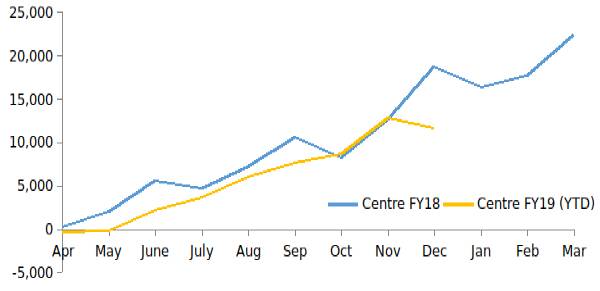
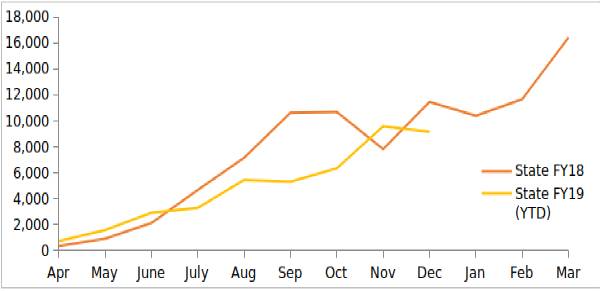 Source: Acuité Research, RBI
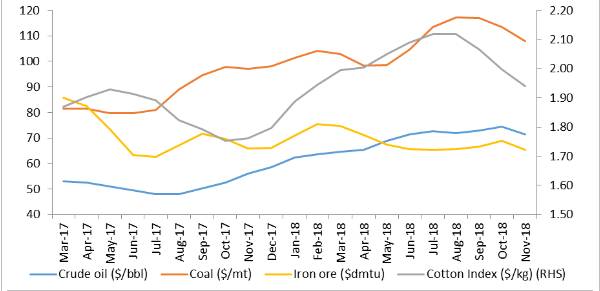
Commodity Price Index (3 Month Moving Average):
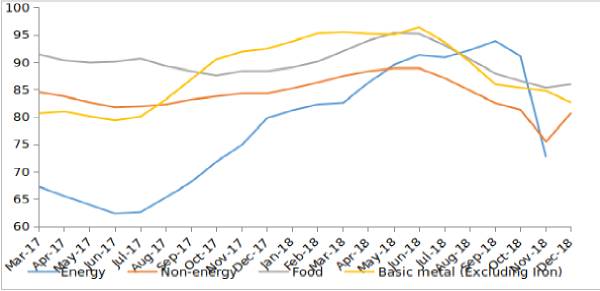
Commodity Price Movement (3 Month Moving Average):
USD-INR Movement
 Source: RBI, Acuité Research
 +91 99698 98000
 info@acuite.in
 Follow us
 +91 22 49294000
 DOWNLOAD